2024: UH-TSU Texas Trends Survey
Lieutenant Governor Bill Hobby. Congresswoman Barbara Jordan. Congressman Mickey Leland – three Texas legends who dedicated their lives to serving the Lone Star State.
Their political careers were in full swing in the early 1970s when the Texas population was smaller and less diverse. They had a common goal: to create a better state for everyone.
In the spirit of these Texas political pioneers, the Hobby School of Public Affairs at the University of Houston and the Executive Master of Public Administration Program in the Barbara Jordan – Mickey Leland School of Public Affairs at Texas Southern University launched the Texas Trends Survey, a five-year project to study Texas’s changing population and opinions, in 2021. The data from the annual surveys and reports will be shared with policymakers, business and community leaders, academics and the public. With objective data, decision-makers throughout the state will be equipped to determine the best routes leading to a better Texas for everyone.
The 2024 Texas Trends survey was fielded between June 20 and July 1, 2024 and focused on opinions about the general election and public policies. The survey was conducted in English and Spanish, with 2,257 YouGov respondents 18 years of age and older (including an oversample of Black Texans), resulting in a confidence interval of +/-2.1 for the overall survey population and +/- 2.5 for the sub-population of 1,484 likely voters. The statewide survey results will be presented in five separate reports: the November 2024 election, school choice/vouchers, housing, immigration and climate challenges.
Report One. Texas Trends Survey: General Election 2024
The first report of the 2024 Texas Trends survey examines the vote intention of Texas likely voters in the November 2024 presidential, U.S. Senate and Texas railroad commissioner races, explores the impact of different issues and events on the presidential vote decision of Texas likely voters and looks at candidate approval ratings.
Highlights
- In the 2024 presidential election, 49% of Texas likely voters intend to vote for Donald Trump, 40% for Joe Biden, 5% for Robert F. Kennedy, Jr. and 2% for other candidates, with 4% undecided.
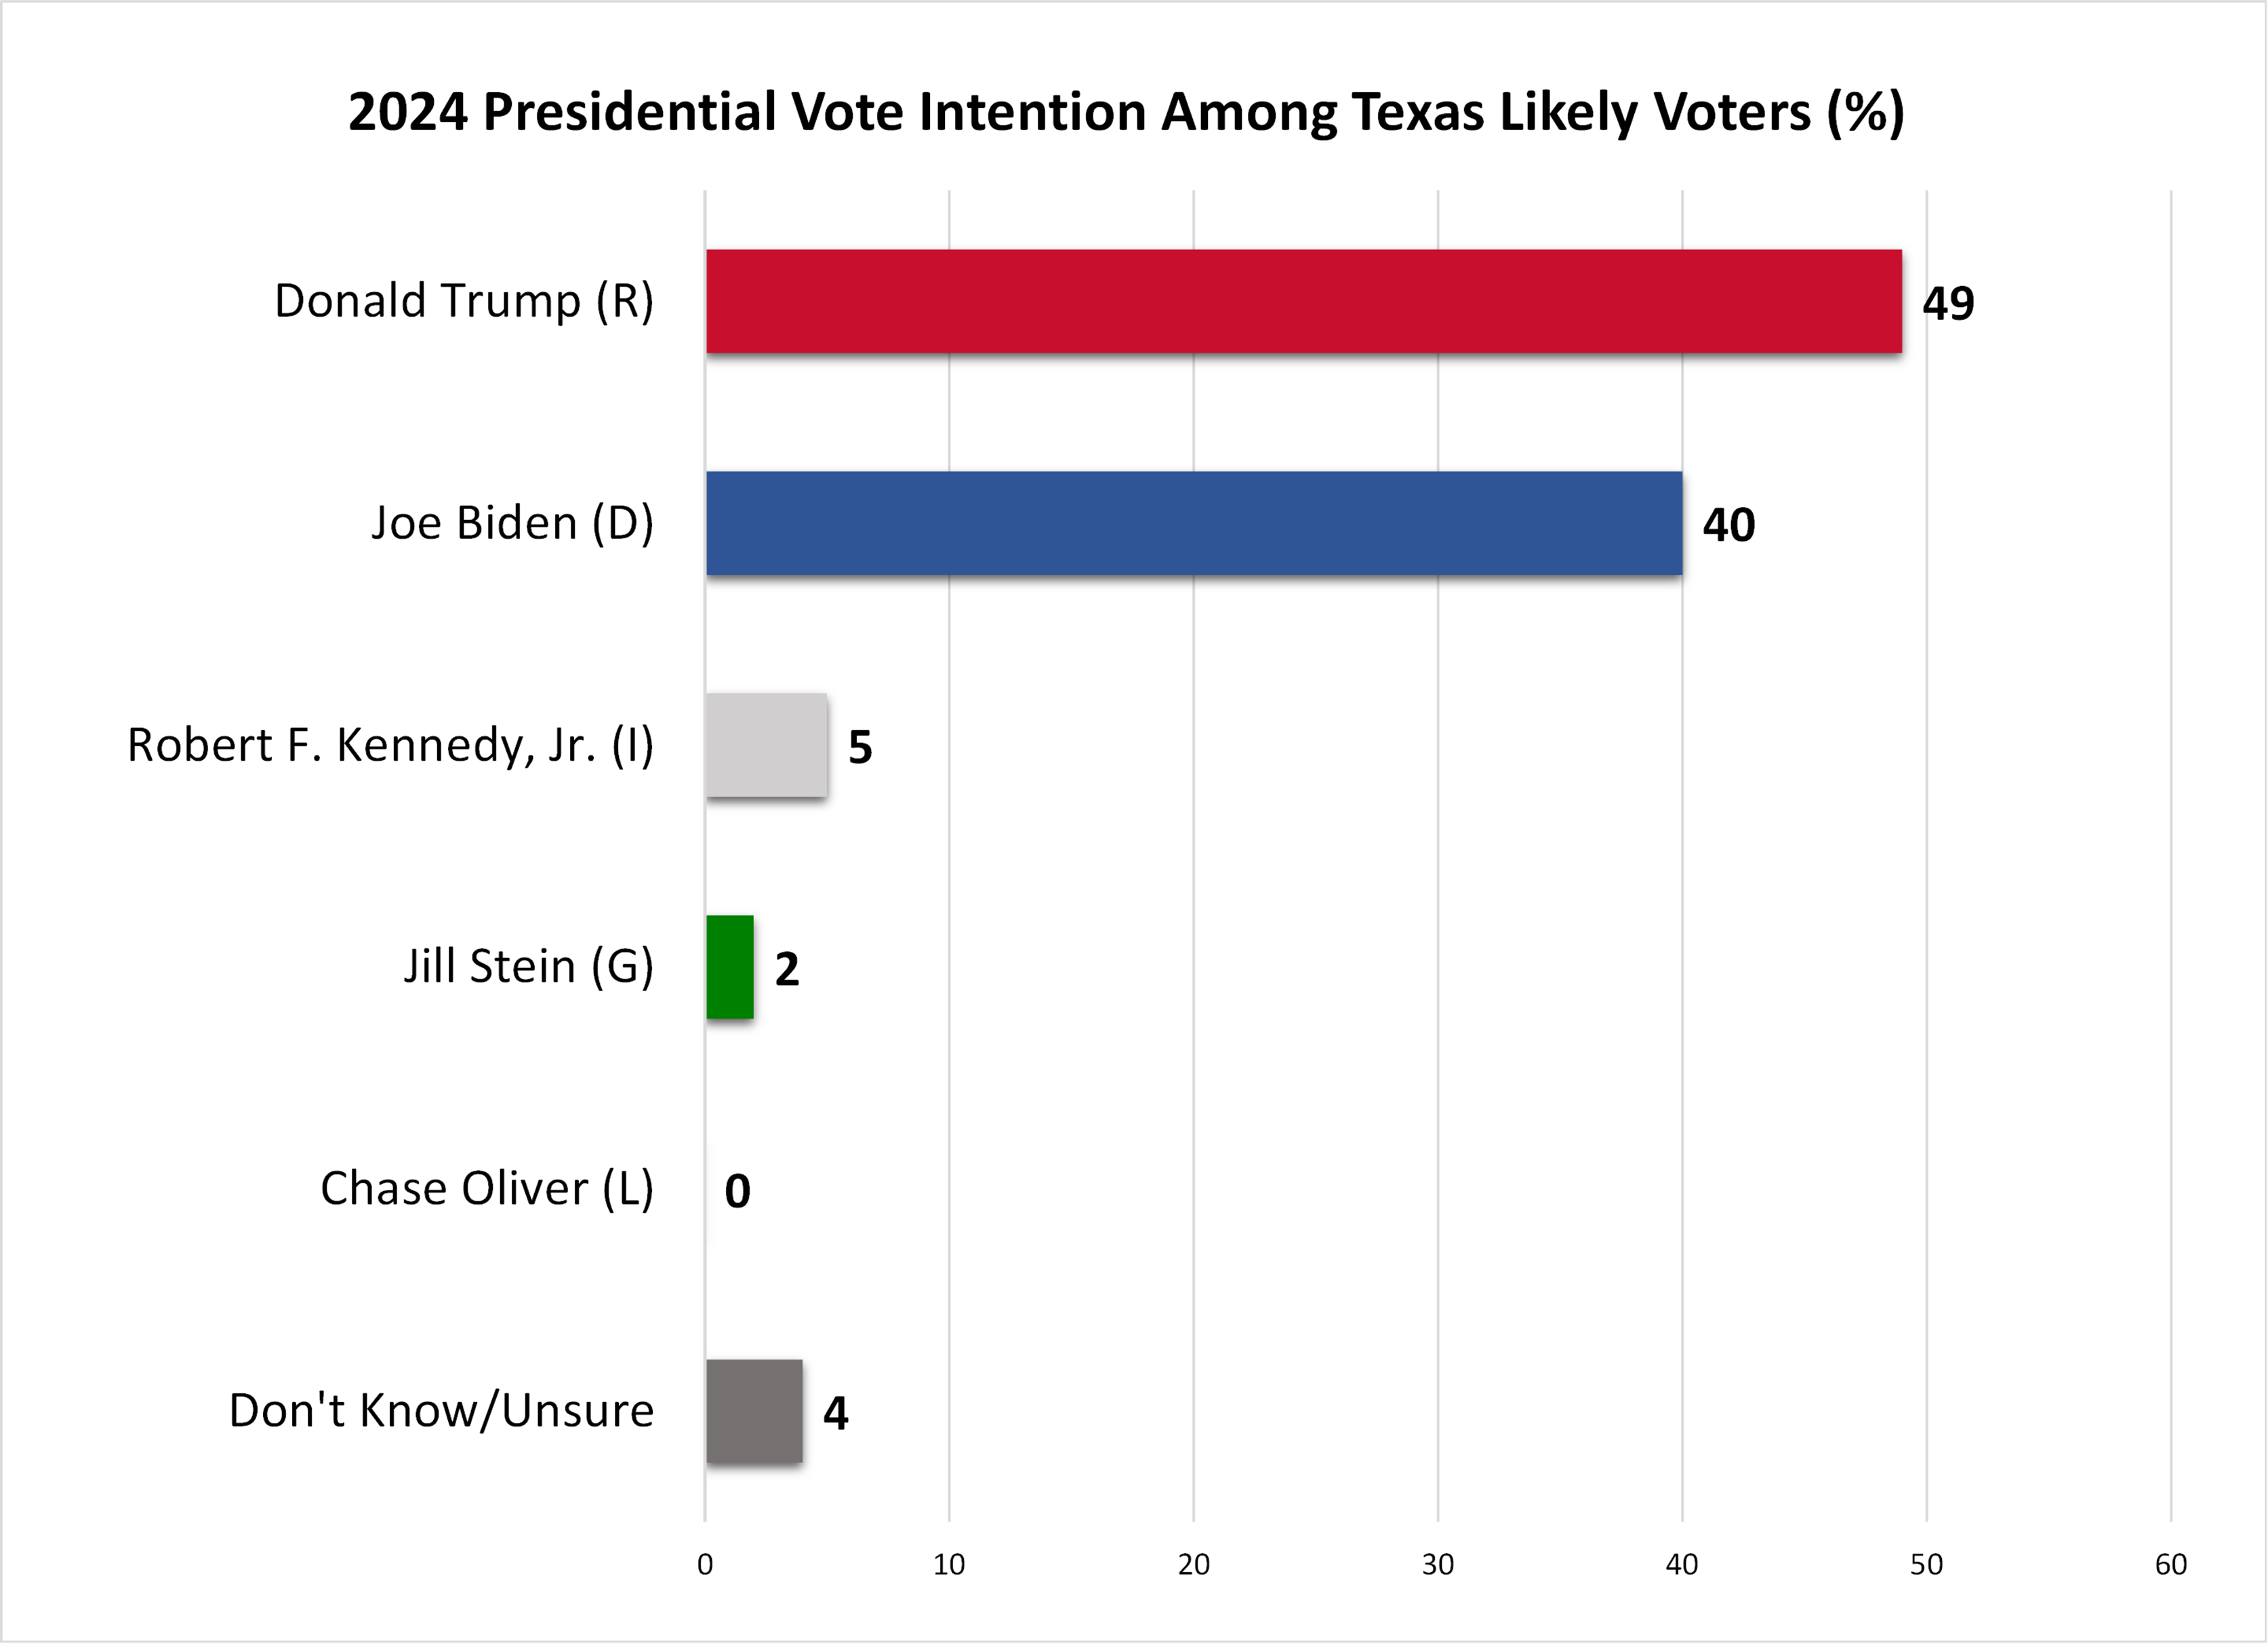
- 94% of Biden voters and 92% of Trump voters say they are certain to vote for their candidate in November, with only 6% and 8% saying they might change their mind.
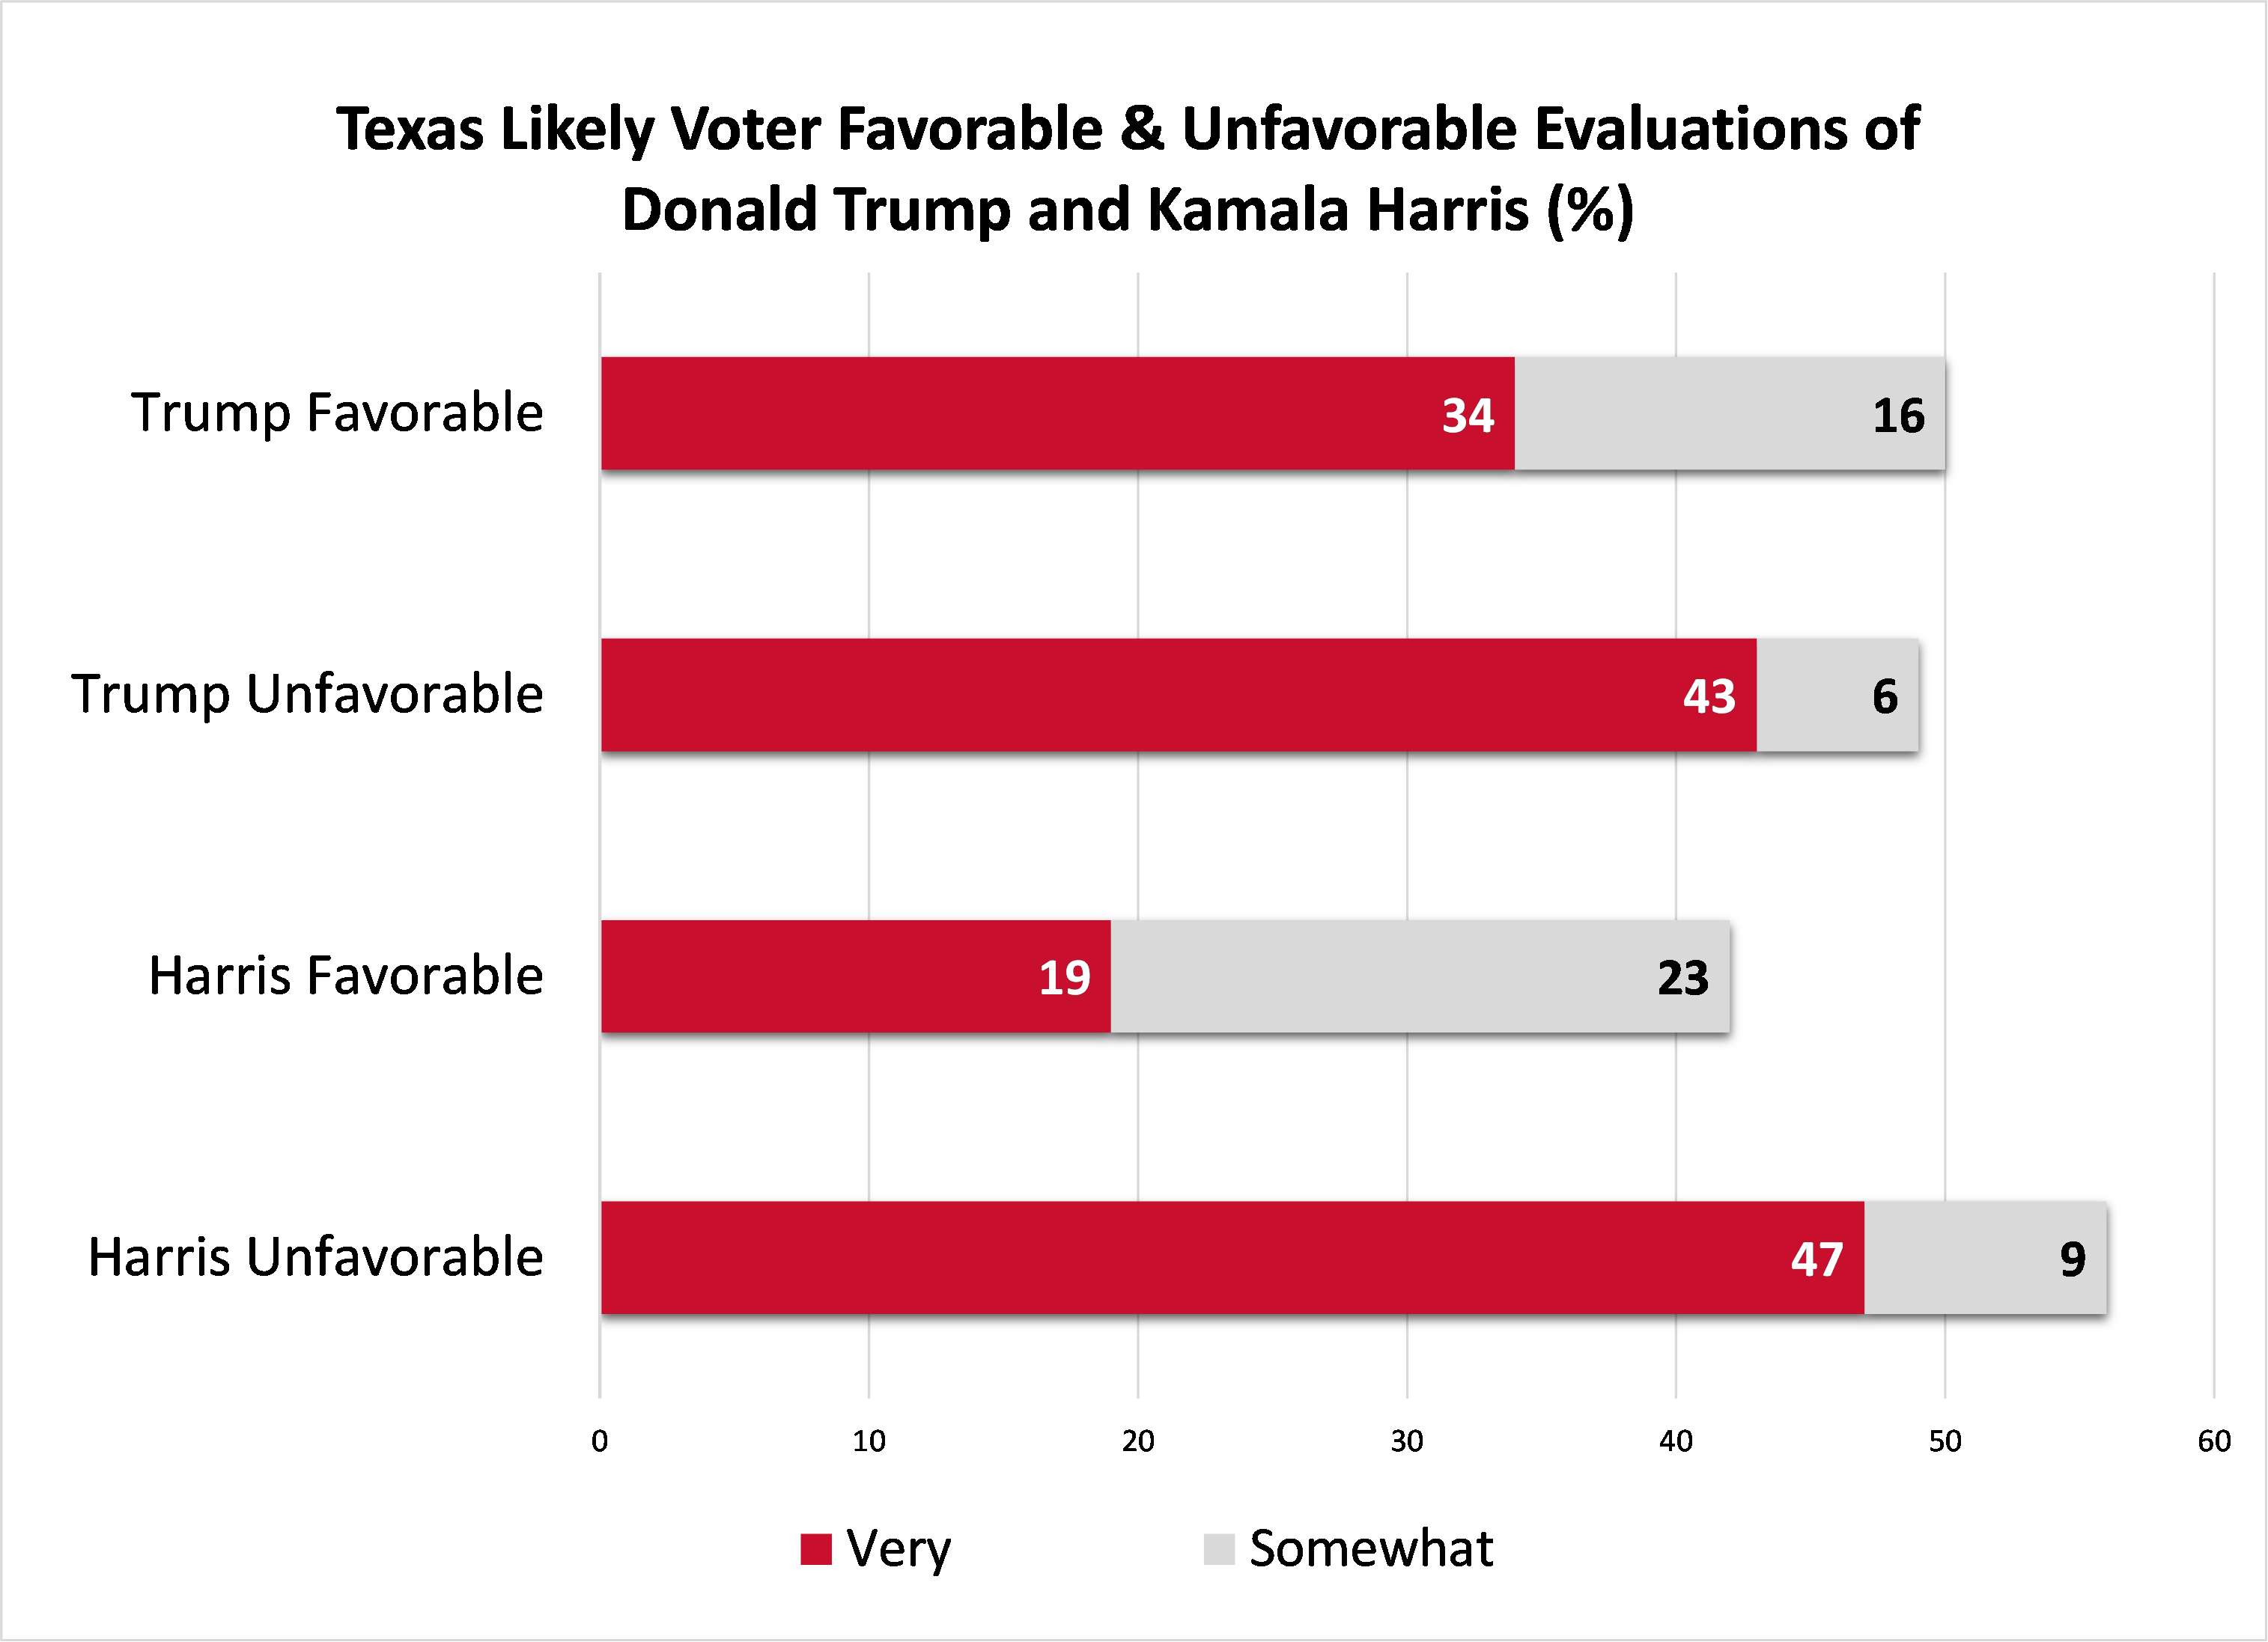
- 50% of Texas likely voters hold a favorable opinion of Trump (34% very favorable) and 49% hold an unfavorable opinion of Trump (43% very unfavorable).
- 44% of Texas likely voters hold a favorable opinion of Biden (24% very favorable) and 55% hold an unfavorable opinion of Biden (47% very unfavorable).
- 42% of Texas likely voters hold a favorable opinion of Kamala Harris (19% very favorable) and 56% hold an unfavorable opinion of Harris (47% very unfavorable).
- 23% of Texas likely voters identified immigration and border security as the most important issue influencing their presidential vote decision, followed by inflation (15%), the economy (15%) and the future of U.S. democracy (13%).
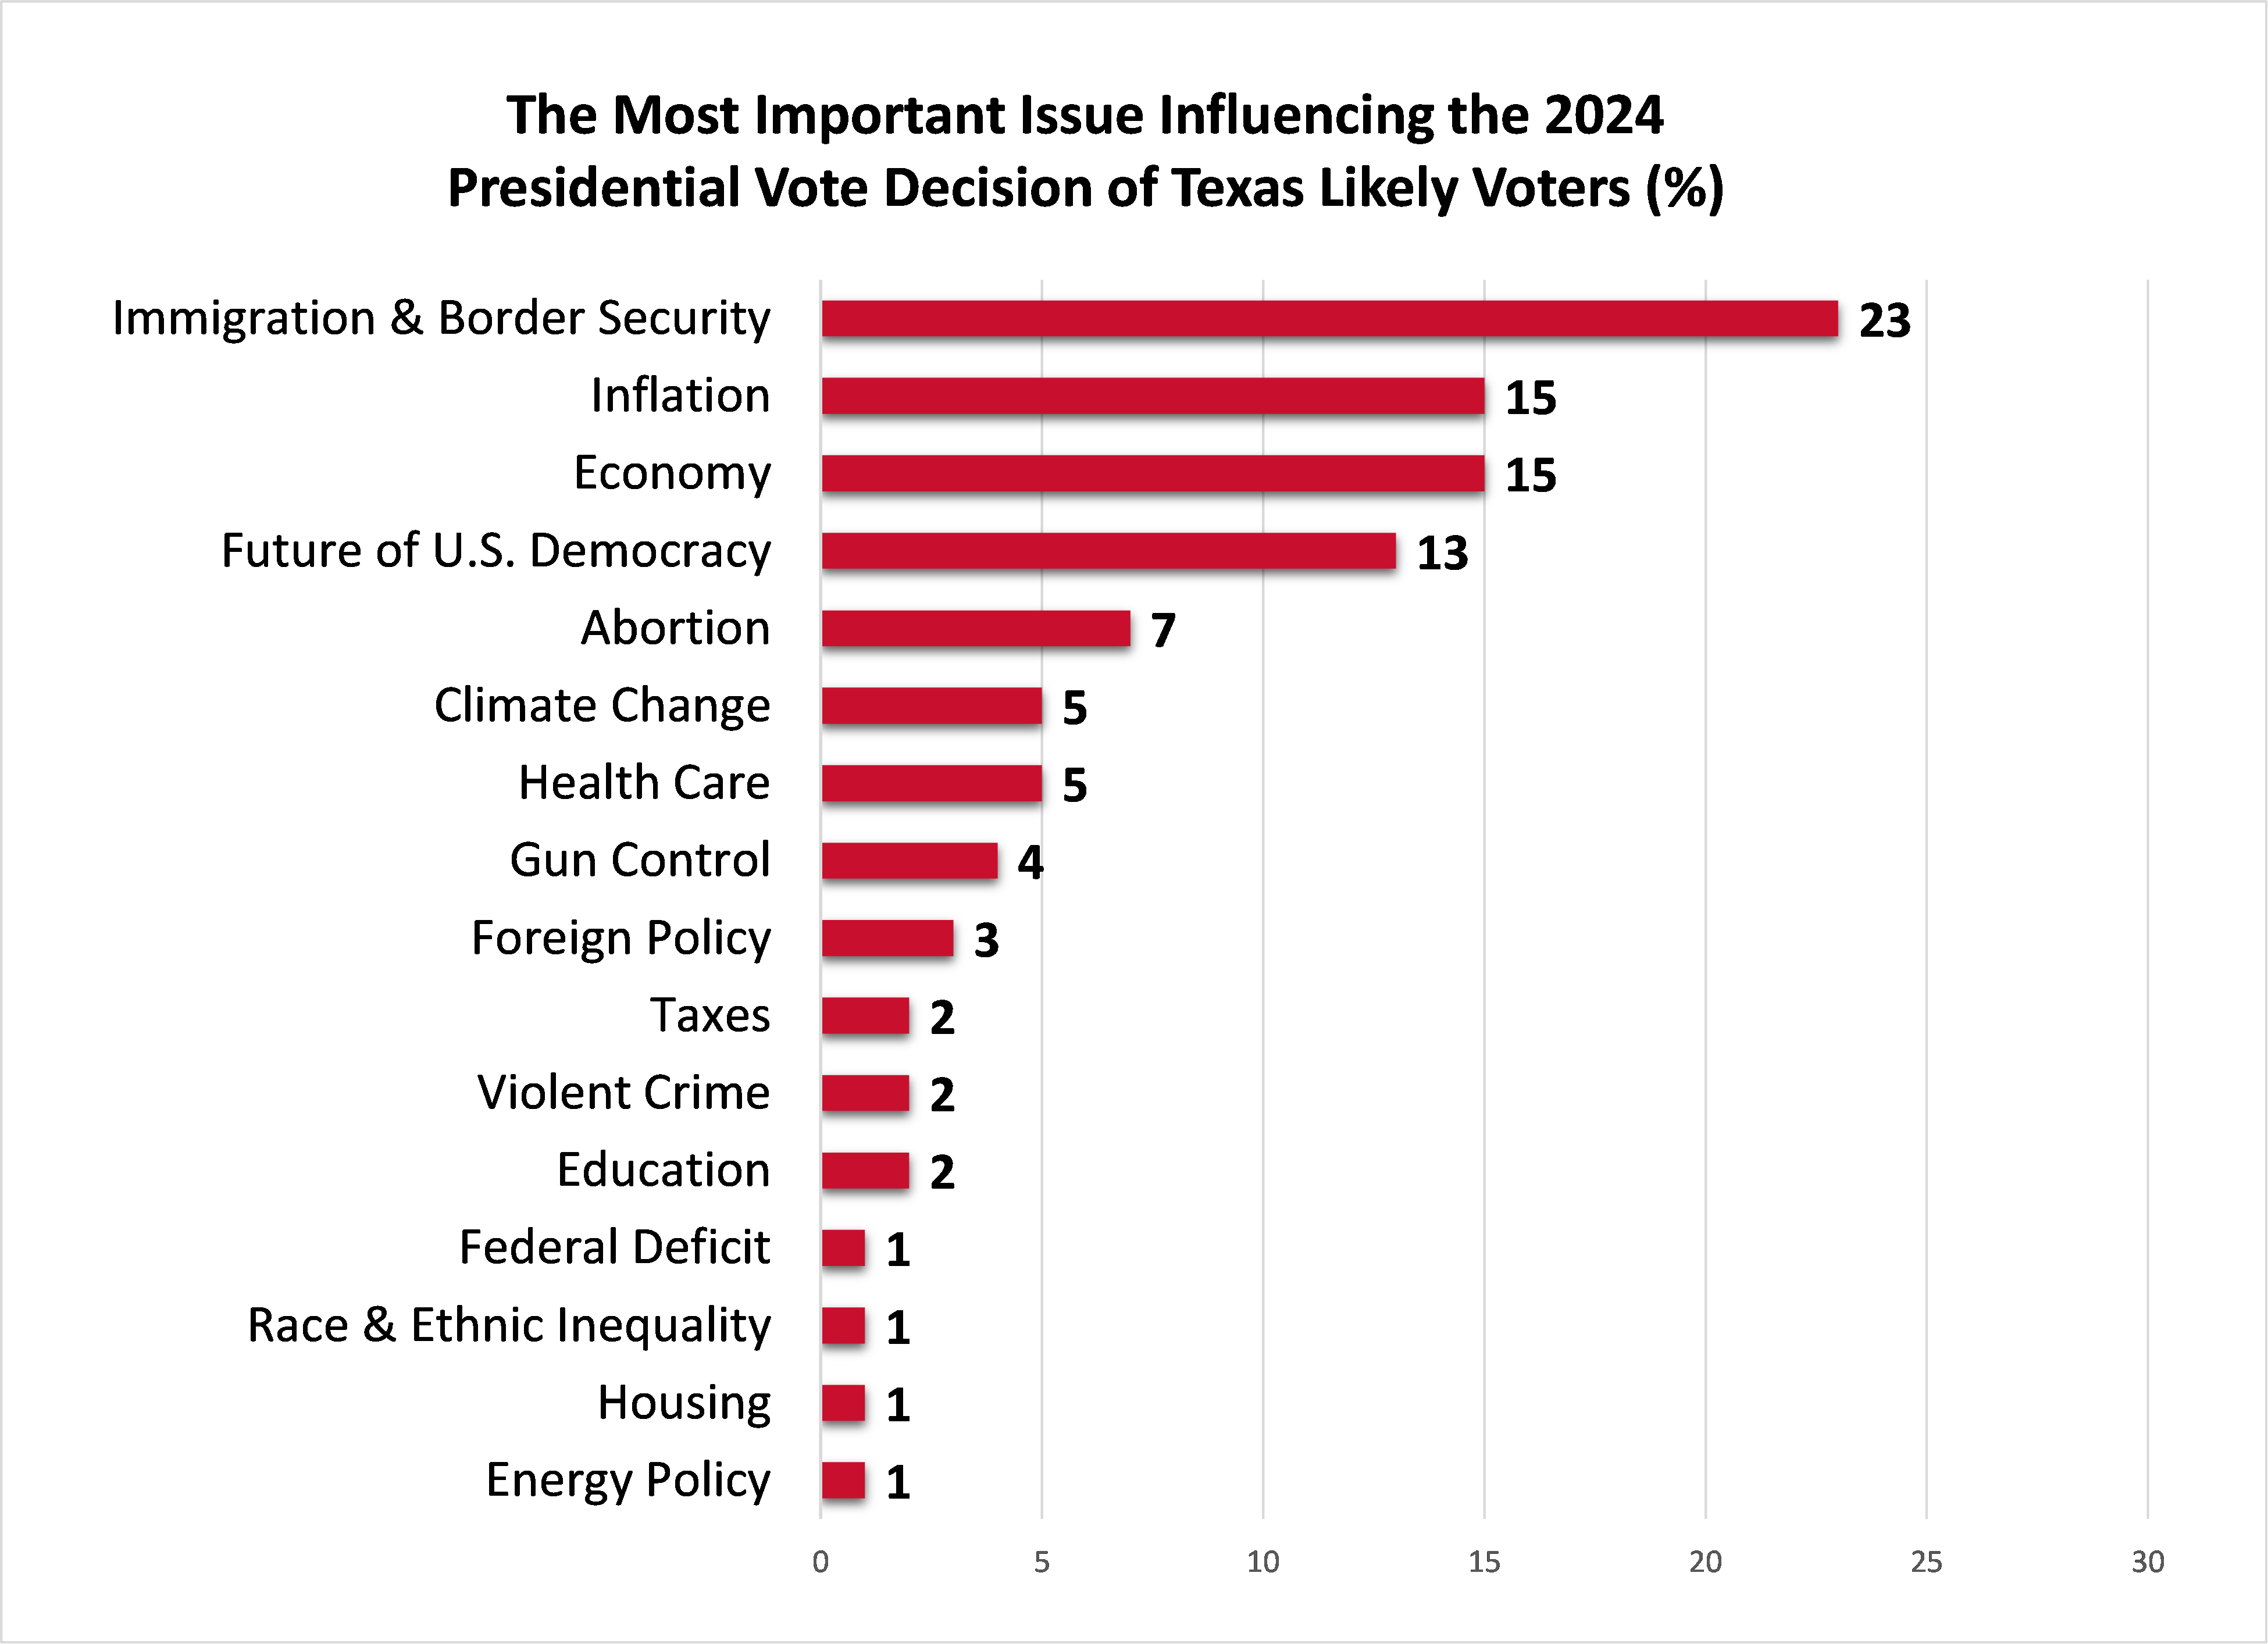
- 47% of likely voters list immigration and border security as among the top three issues influencing their presidential vote decision, followed by the economy (42%), inflation (40%), the future of U.S. democracy (26%) and abortion (23%).
- 51% of likely voters believe Trump is guilty of the charges for which he was recently convicted in a Manhattan court, including 93% of Biden voters, but only 10% of Trump voters.
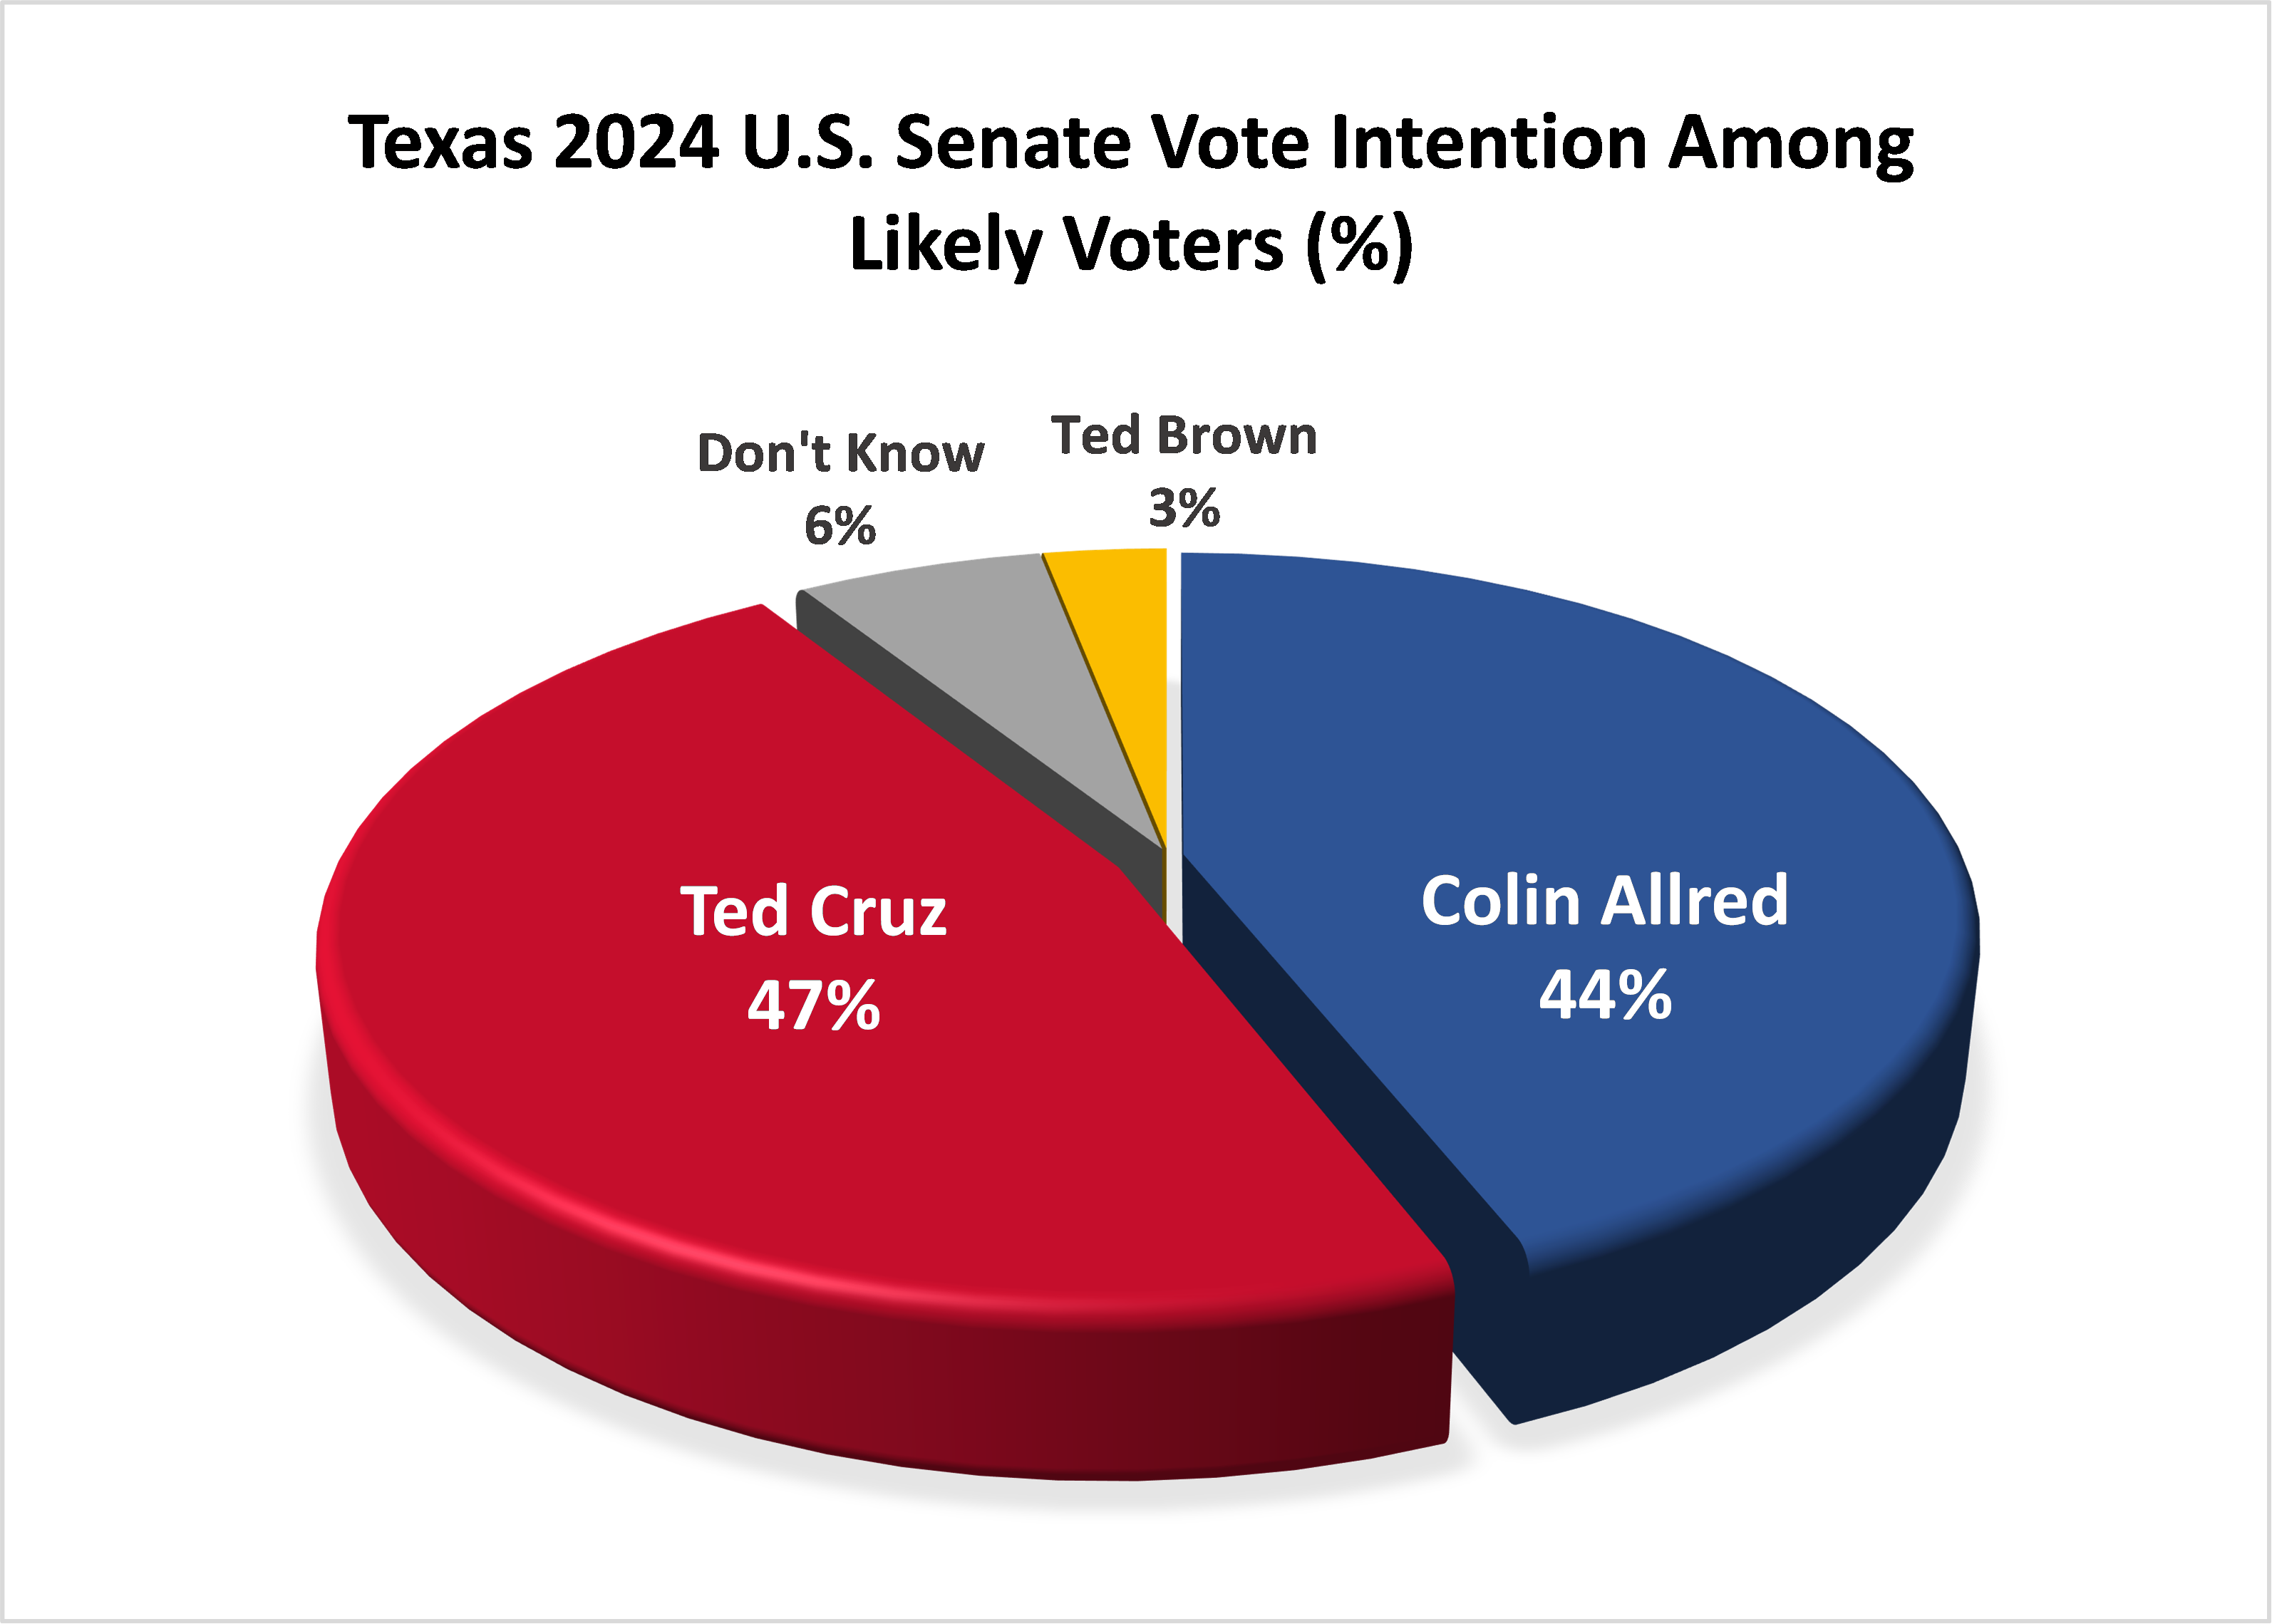
- In the 2024 Texas U.S. Senate election, 47% of likely voters intend to vote for Republican Ted Cruz, 44% for Democrat Colin Allred and 3% for Libertarian Ted Brown, with 6% undecided.
- Cruz leads Allred among men, 50% to 42%, while Allred leads Cruz among women, 46% to 44%.
- Cruz leads Allred among white likely voters (55% to 38%), while Allred leads Cruz among Black likely voters (76% to 15%) and Latino likely voters (47% to 39%).
- 23% of Texas likely voters don’t know enough about Allred to have an opinion about him, compared to only 3% who don’t know enough about Cruz to have an opinion about him.
- 49% of likely voters have a favorable opinion of Cruz (27% very favorable), while 48% have an unfavorable opinion of Cruz (38% very unfavorable).
- 46% of likely voters have a favorable opinion of Allred (21% very favorable), while 31% have an unfavorable opinion of Allred (17% very unfavorable).
- In the 2024 race for Texas Railroad Commissioner, 41% of likely voters intend to vote for Republican Christi Craddick, 35% for Democrat Katherine Culbert, 3% for Libertarian Hawk Dunlap and 3% for the Green Party’s Eddie Espinoza, with 18% still undecided.
- Almost one-half (49%) of Texas likely voters believe things in Texas are off on the wrong track, while 43% believe they are going in the right direction.
- Almost two-thirds (65%) of Texas likely voters believe things in the United States are off on the wrong track, with 28% of the opinion that things in the United States are going in the right direction.
Read Report One to learn more about where likely Texas voters stand on the 2024 candidates and issues, including differences of opinion when considering gender, age, race/ethnicity and partisanship.
Media Release, July 11, 2024
Report Two. Texas Trends Survey: Outage Experiences and Preparedness in the Shadow of Hurricane Beryl
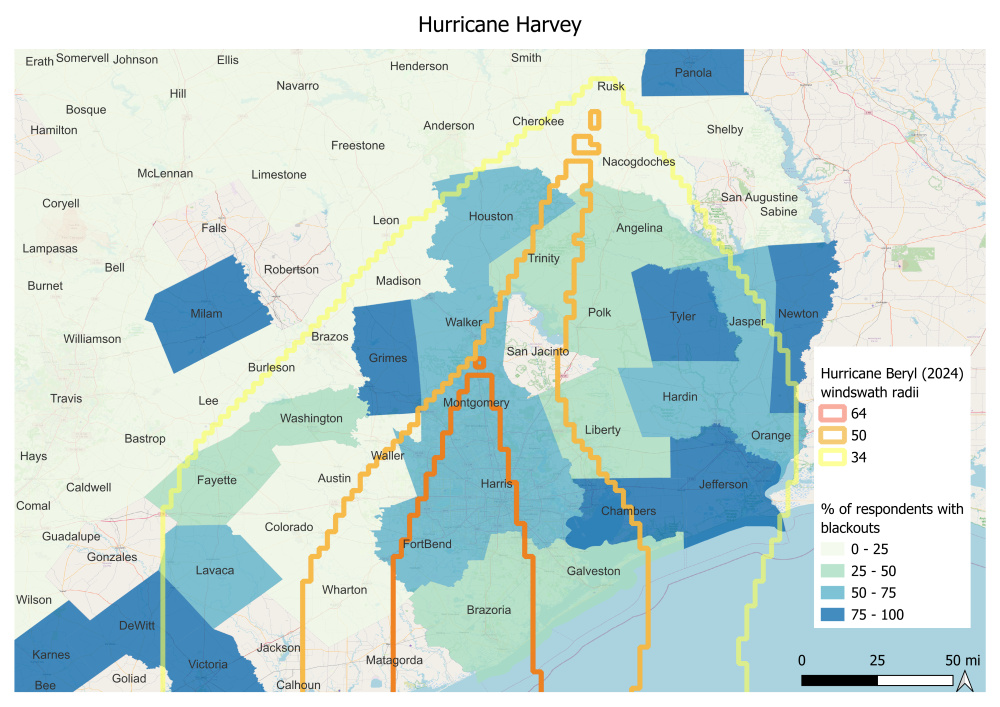
With two mass power outage events within two months and government officials and customers increasingly critical of CenterPoint, the debate about how to improve the resiliency of the power grid and distribution becomes more relevant. Researchers analyzed Texans’ past experiences with power outages caused by natural disasters and their preparedness for extreme weather events following Hurricane Beryl, highlighting critical lessons on the impacts of natural disasters and the future preparedness measures of Texans.
Highlights
- Many Texas households have experienced blackouts from numerous natural disasters in recent years, especially in the larger Houston metro area and coastal region, which were in the path of Hurricane Beryl.
 |
 |
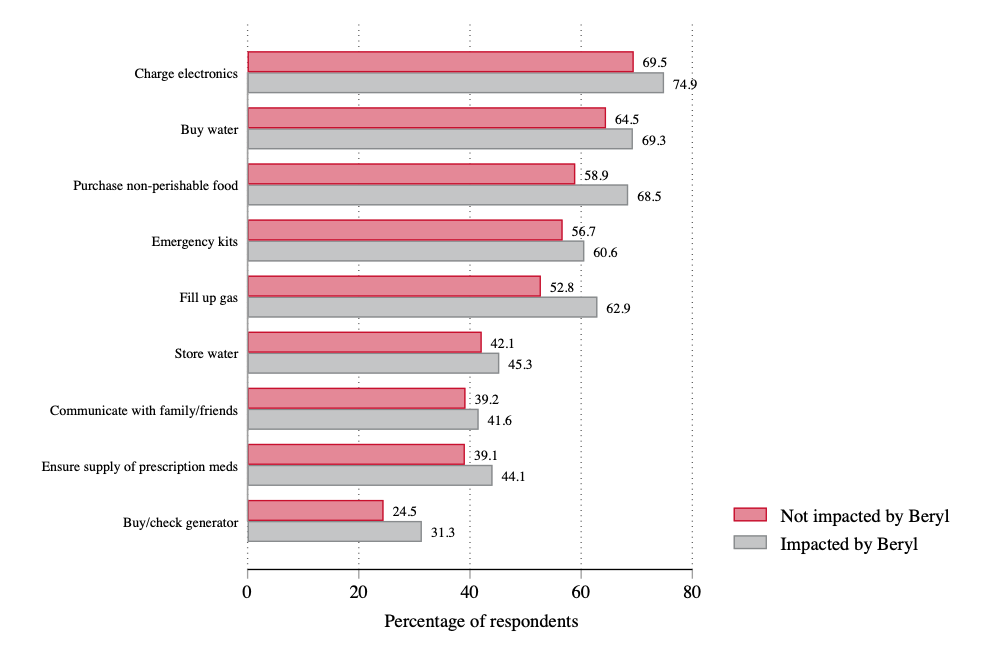
- The most common preparedness measures by respondents include charging electronic devices (71%), purchasing essential supplies like water (66%) and non-perishable food (61%), purchasing emergency kits (58%), and filling gas tanks (55%). These percentages are higher than 60% for those respondents living along the Hurricane Beryl path.
- On average, each respondent from Houston, Austin, and San Antonio reported adopting 5, 4.9, and 4.7 different types of measures of preparedness, respectively. In contrast, respondents from Dallas reported an average of 4.1 measures.
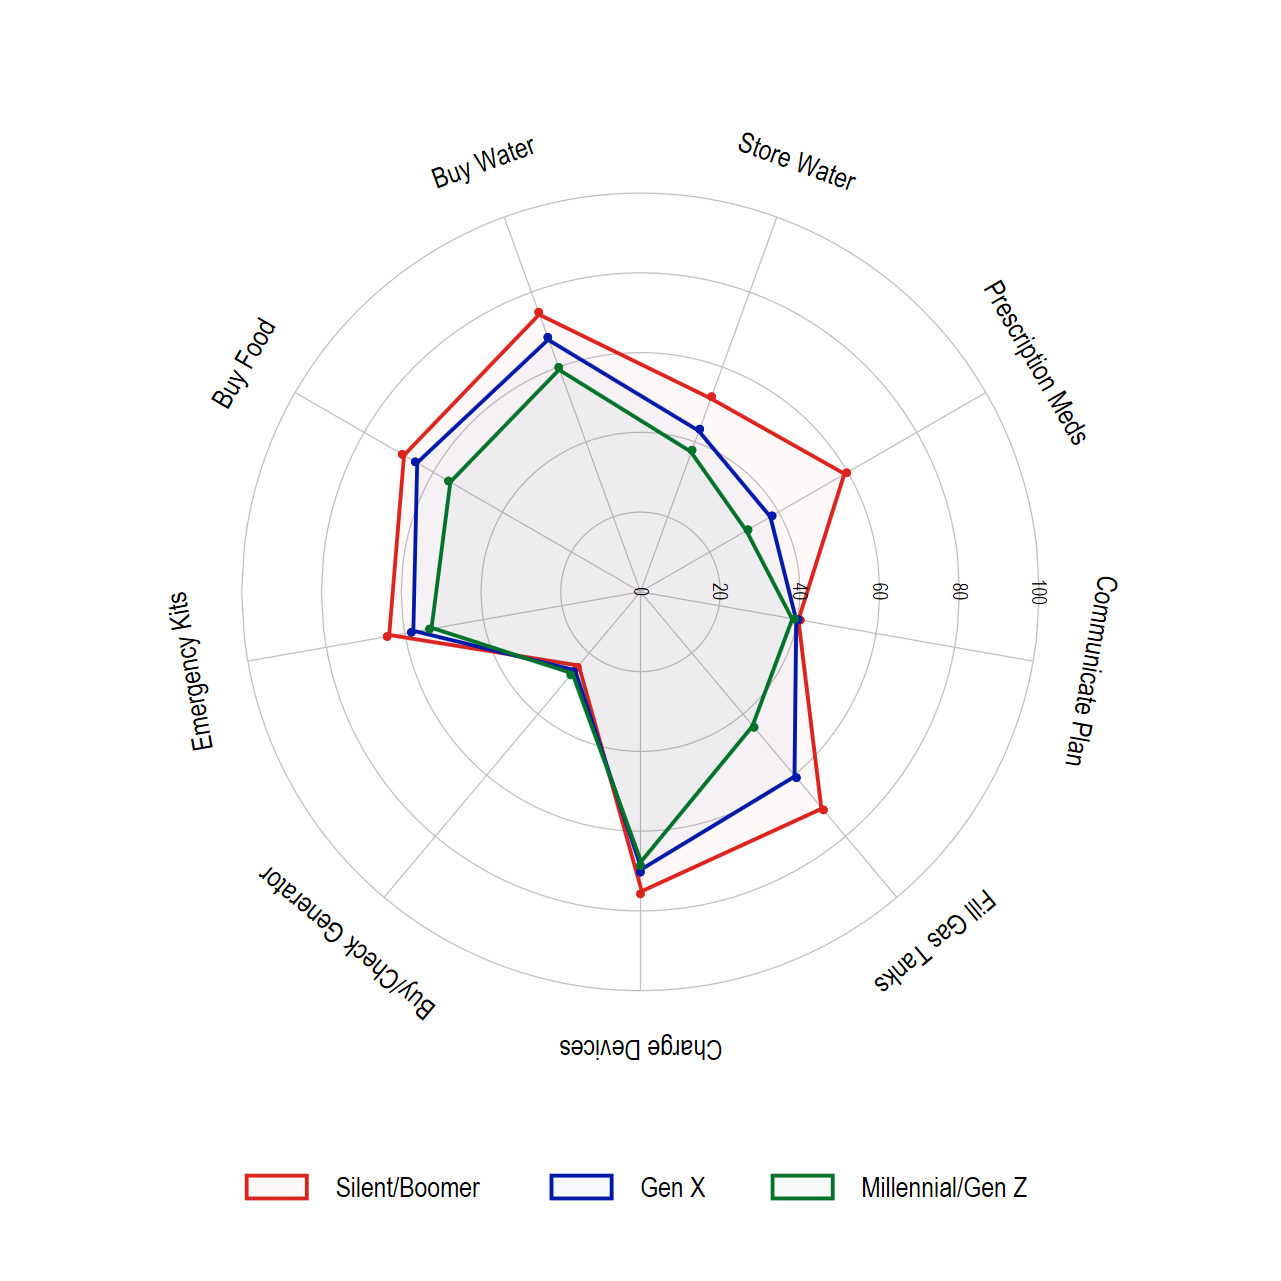
- Overall, older respondents, those in the Silent or Boomer generations, took
the most steps, while younger respondents were the least likely to take any steps
in preparation for the 2024 hurricane season.
- While a substantial number of Texans take steps to prepare for hurricane seasons, significant gaps remain. Extreme weather events and natural disasters have led some Texans to purchase power generators. While this is a natural response for a household, especially for those who can afford the investment, the measure is far from optimal for the community. Researchers also identify a need for targeted interventions to bolster infrastructure resilience in high-risk areas.
Read Report Two to learn about Texans' past experiences with extreme weather, including prolonged power outages, and how those experiences impacted their preparedness for future events. The special report includes differences of opinion when considering demographics.
Media Release, July 18, 2024
Report Three. Texas Trends Survey: Favorability Evaluations
The third report of the 2024 Texas Trends survey focuses on favorability evaluations of President Joe Biden, Vice President Kamala Harris, former president Donald Trump and other political figures among Texas likely voters.
Highlights
- 42% of likely Texas voters have a favorable opinion of Kamala Harris, while 56% hold an unfavorable opinion.
- 50% of likely Texas voters have a favorable opinion of Donald Trump, while 49% hold an unfavorable opinion.
- Among Texas women likely to vote, 47% have a favorable opinion of Donald Trump, while 44% hold a favorable opinion of Kamala Harris.
- Among Texas men likely to vote, 54% have a favorable opinion of Donald Trump, while 42% hold a favorable opinion of Kamala Harris.
- Among likely Generation Z voters in Texas, 50% hold a favorable opinion of Kamala Harris, while 43% have a favorable opinion of Donald Trump.
Read Report Three to learn more about the favorability evaluations of political figures among likely Texas voters, including differences of opinion when considering gender, age, race/ethnicity, education and partisanship.
Report Four. Texas Trends Survey: School Vouchers & Education Savings Accounts (ESAs)
The fourth report of the 2024 Texas Trends survey examines the support for and opposition to school voucher and educational savings account (ESA) legislative proposals as well as agreement and disagreement with the most common arguments made against and in favor of school voucher/ESA legislative proposals.
Highlights
- 65% of Texans support the adoption of legislation that would provide school vouchers to all parents in Texas, with 33% strongly supporting this legislation.
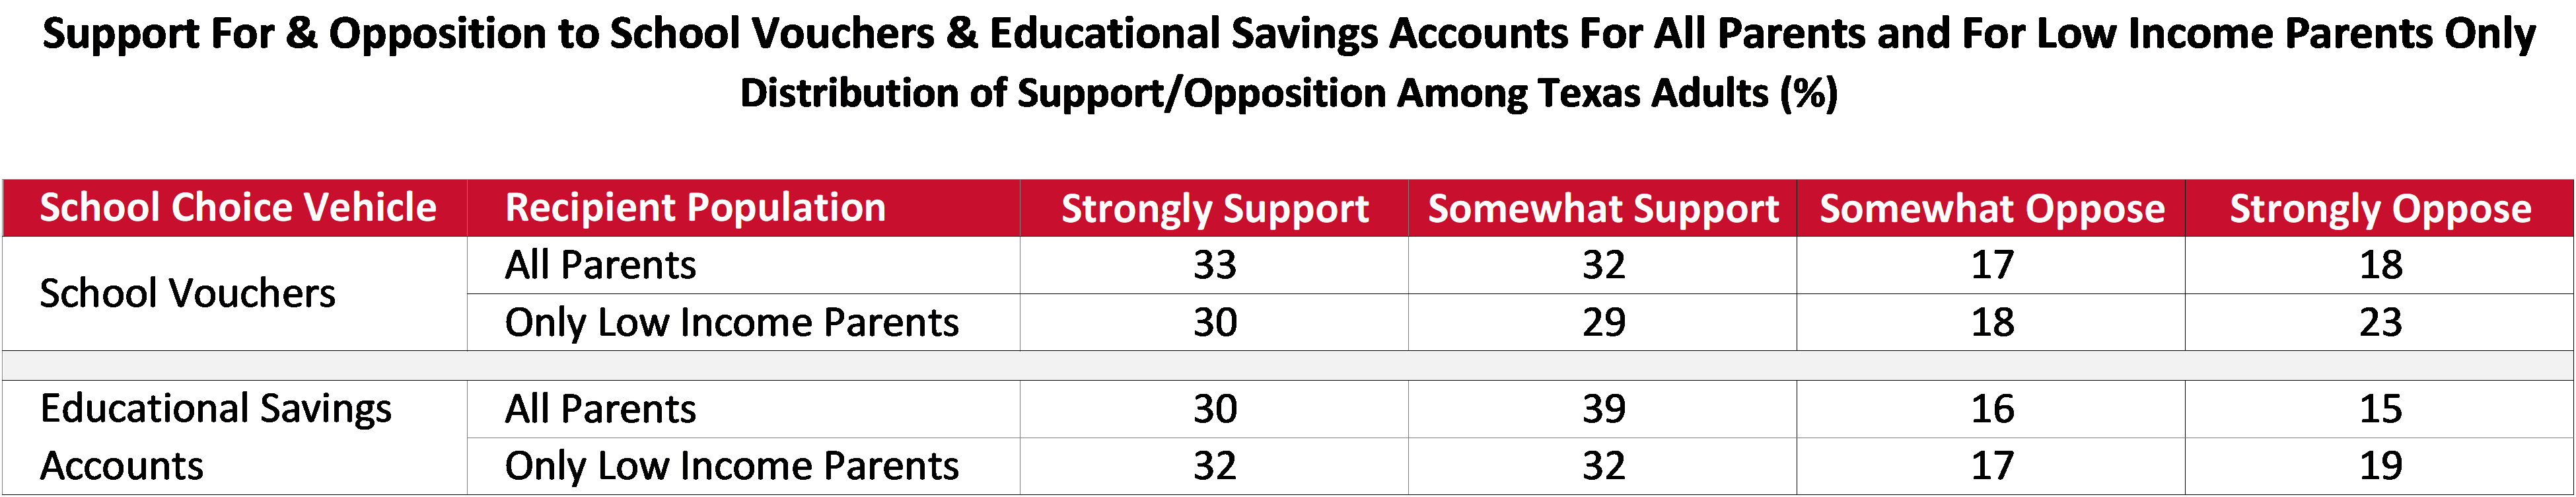
- 69% of Texans support the adoption of legislation that would create Educational Savings Accounts (ESAs) for all parents in Texas, with 30% strongly supporting this legislation.
- 59% of Texans support the adoption of legislation that would provide school vouchers only to low income parents in Texas, with 30% strongly supporting this legislation.
- 64% of Texans support the adoption of legislation that would create Educational Savings Accounts (ESAs) for low income parents only in Texas, with 32% strongly supporting this legislation.
- 66% of Texans agree (31% strongly) with the anti-voucher/ESA argument that vouchers/ESAs funnel money away from already struggling public schools.
- 63% of Texans agree (28% strongly) with the anti-voucher/ESA argument that vouchers/ESAs provide funding to private schools and individuals with only limited accountability for how the funds are used.
- 62% of Texans agree (29% strongly) with the anti-voucher/ESA argument vouchers/ESAs fail to accommodate disabled and special needs students, who public schools are required to accept while private schools are not.
- 55% of Texans agree (27% strongly) with the anti-voucher/ESA argument that voucher/ESA’s use of tax dollars to subsidize religious schools violates the constitutional separation of church and state.
Read Report Four to learn about where likely Texas voters stand on school vouchers and educational savings accounts, including differences of opinion when considering gender, age, race/ethnicity, education, partisanship, income, religion and other variables.
Media Release, July 29, 2024
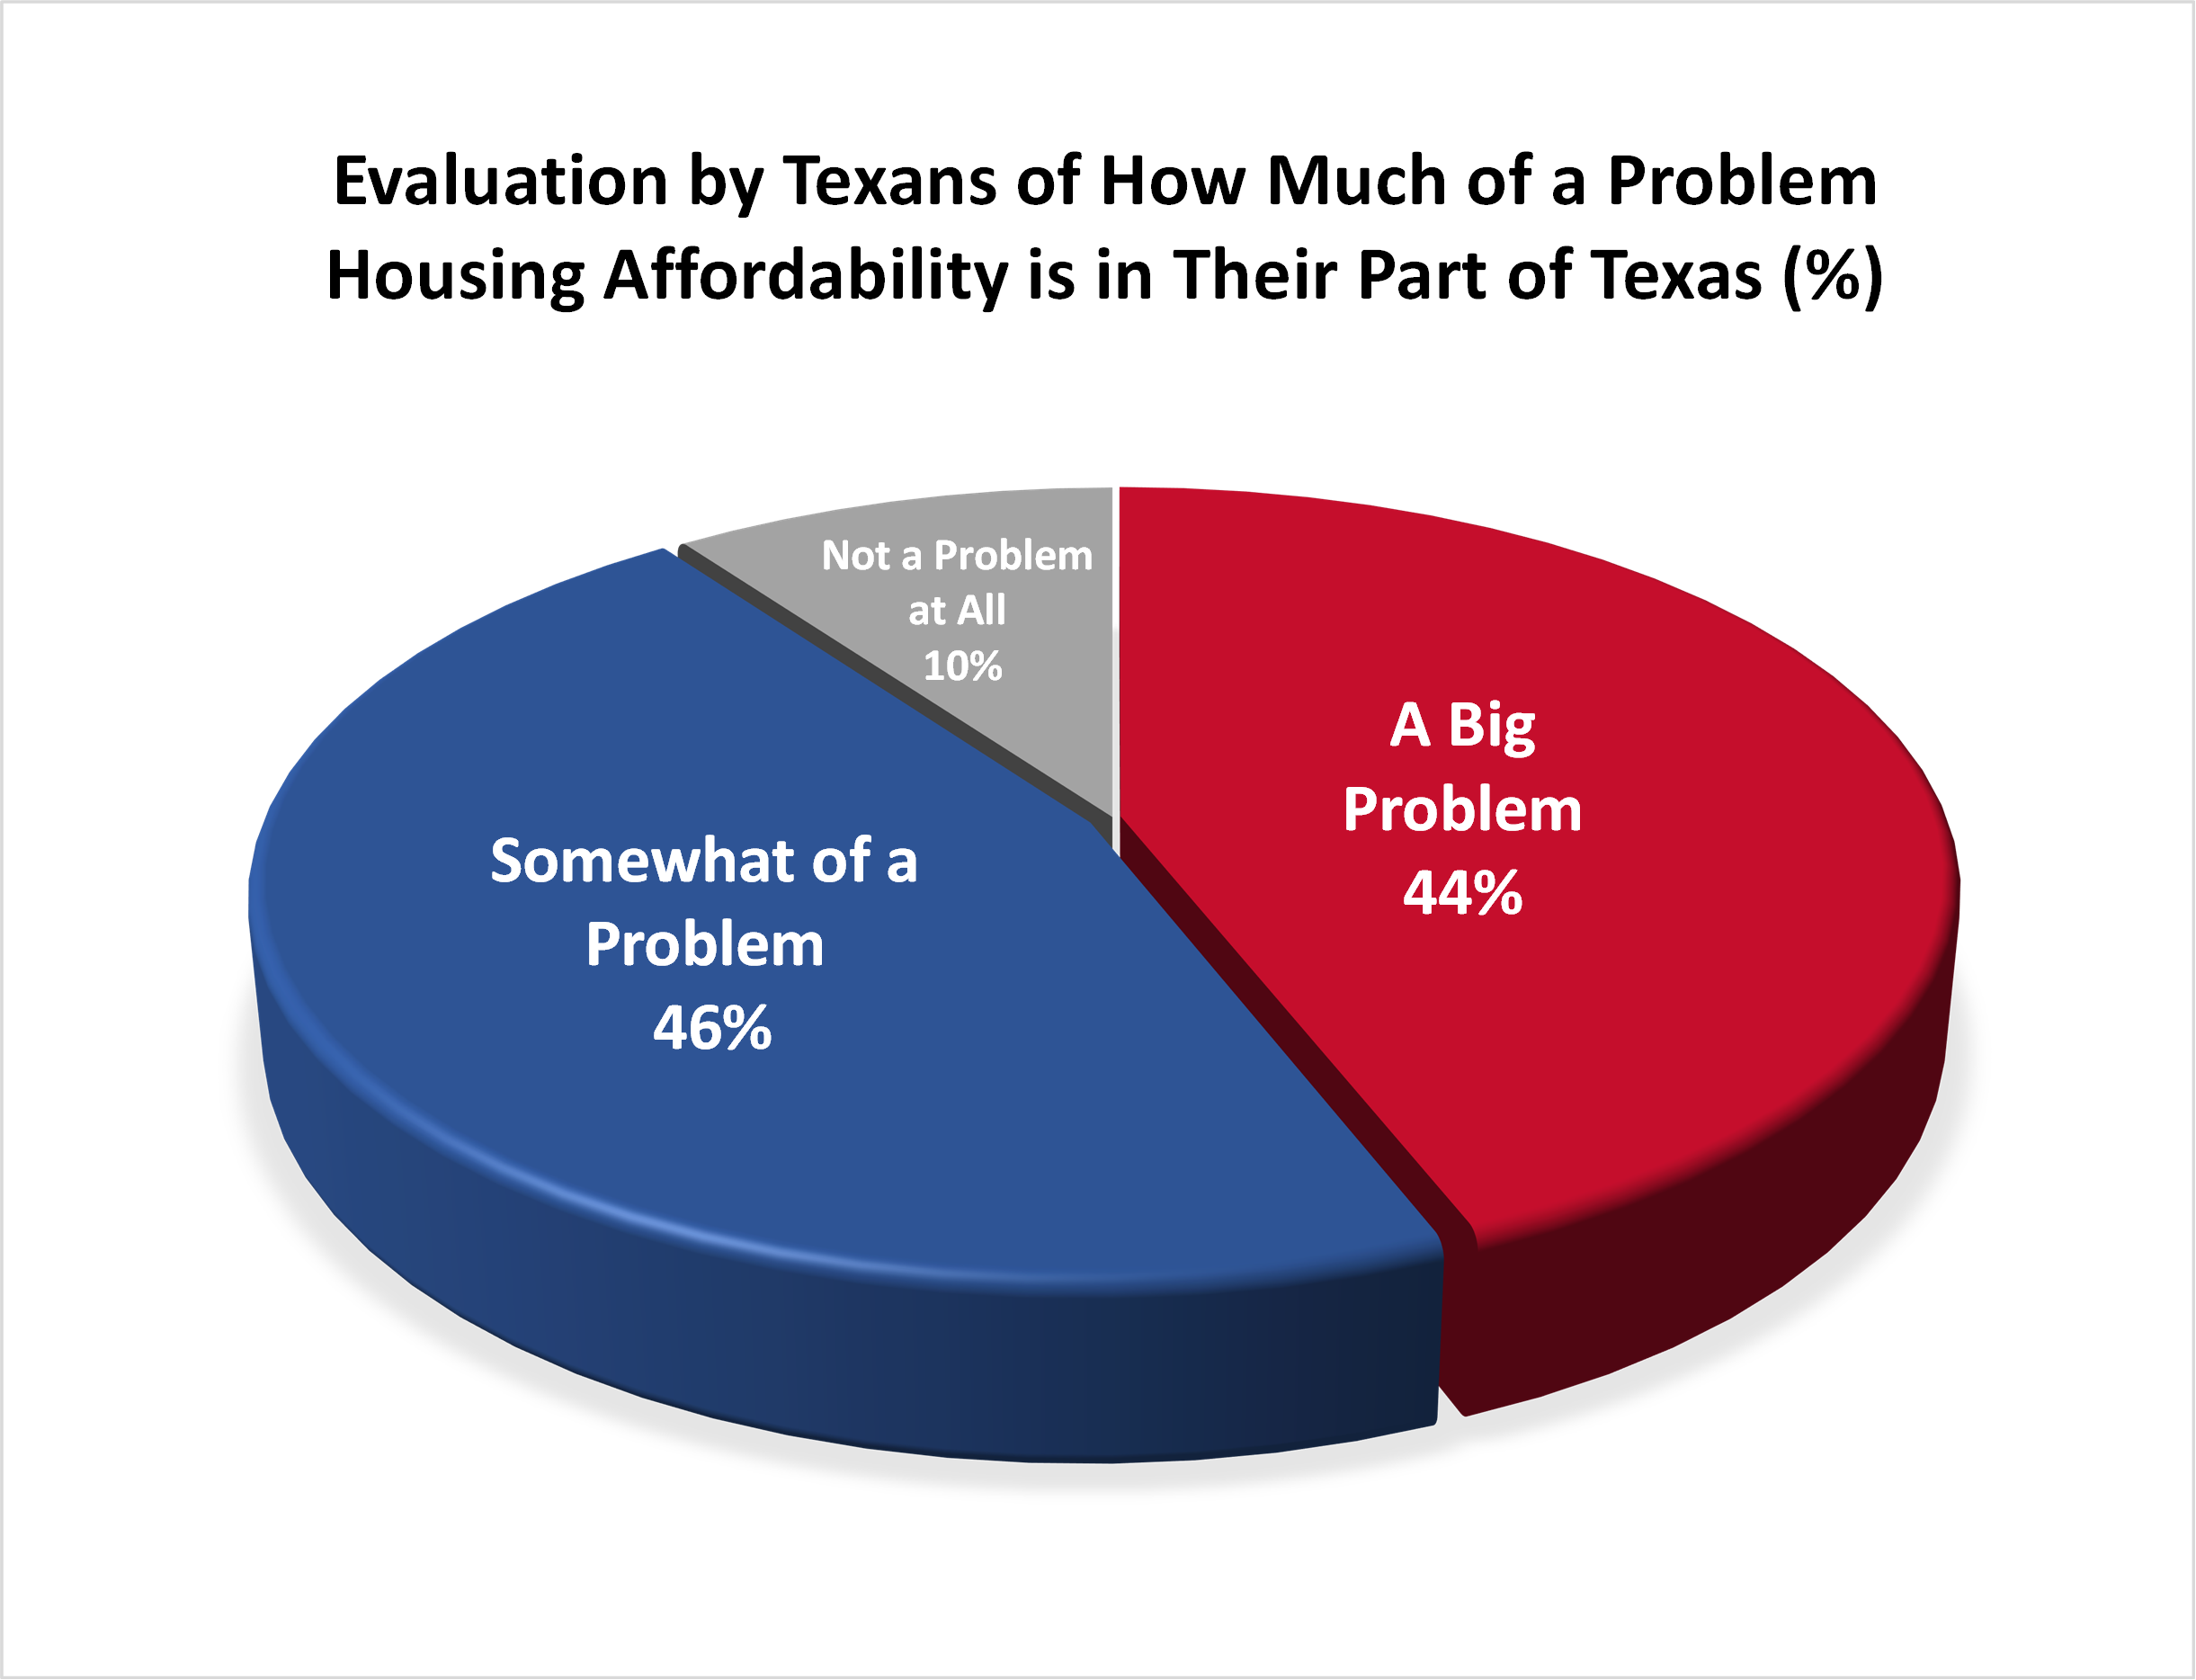
Report Five. Texas Trends Survey: Housing
The fifth report of the 2024 Texas Trends survey examines public opinion related to several housing related issues, including evaluations of local housing affordability, support for policies to increase the amount of rental housing for low income and middle income Texans, and the degree and sources of financial strain placed on Texans by housing costs.
Highlights
- 90% of Texans consider housing affordability to be a problem in their part of Texas, with 44% considering it to be a big problem and 46% somewhat of a problem.
- 54% of Texans favor government policies intended to increase the amount of affordable housing for lower and middle income Texans, while 26% oppose these policies.
- 53% of Latino Texans and 50% of Black Texans believe that housing affordability is a big problem in their part of Texas, compared to 39% of white Texans.
- 68% of Texas Democrats and 46% of Texas Republicans favor government policies designed to increase the amount of affordable rental housing.
- 56% of Texans report that the cost of housing represents a source of financial strain for them and their family, with 38% identifying the cost of housing as a major source of strain and 18% identifying the cost of housing as a minor source of financial strain.
- Among Texas homeowners for whom housing costs create a financial strain, the proportion for whom the respective expense represents a major source of financial strain includes the following: utility bills (68%), homeowner insurance (61%), home maintenance (53%), mortgage payments (51%), school property taxes (50%), other local property taxes (50%), home renovations (43%), and HOA dues (21%).
- Among Texas renters for whom housing costs create a financial strain, the proportion for whom the respective expense represents a major source of financial strain includes rent (78%), utility bills (61%), and renter insurance (23%).
Read Report Five to learn about where likely Texas voters stand on housing related issues, including differences of opinion when considering gender, age, race/ethnicity, education, partisanship, income, region and housing status.
Report Six. Texas Trends Survey: Immigration and Border Security Policy
Immigration policy in Texas is highly polarized. Evaluations of national and state immigration policies, support for various immigration policies and the terminology used to describe a person who has entered, lived in or worked in the U.S. without proper authorization vary by party identification.
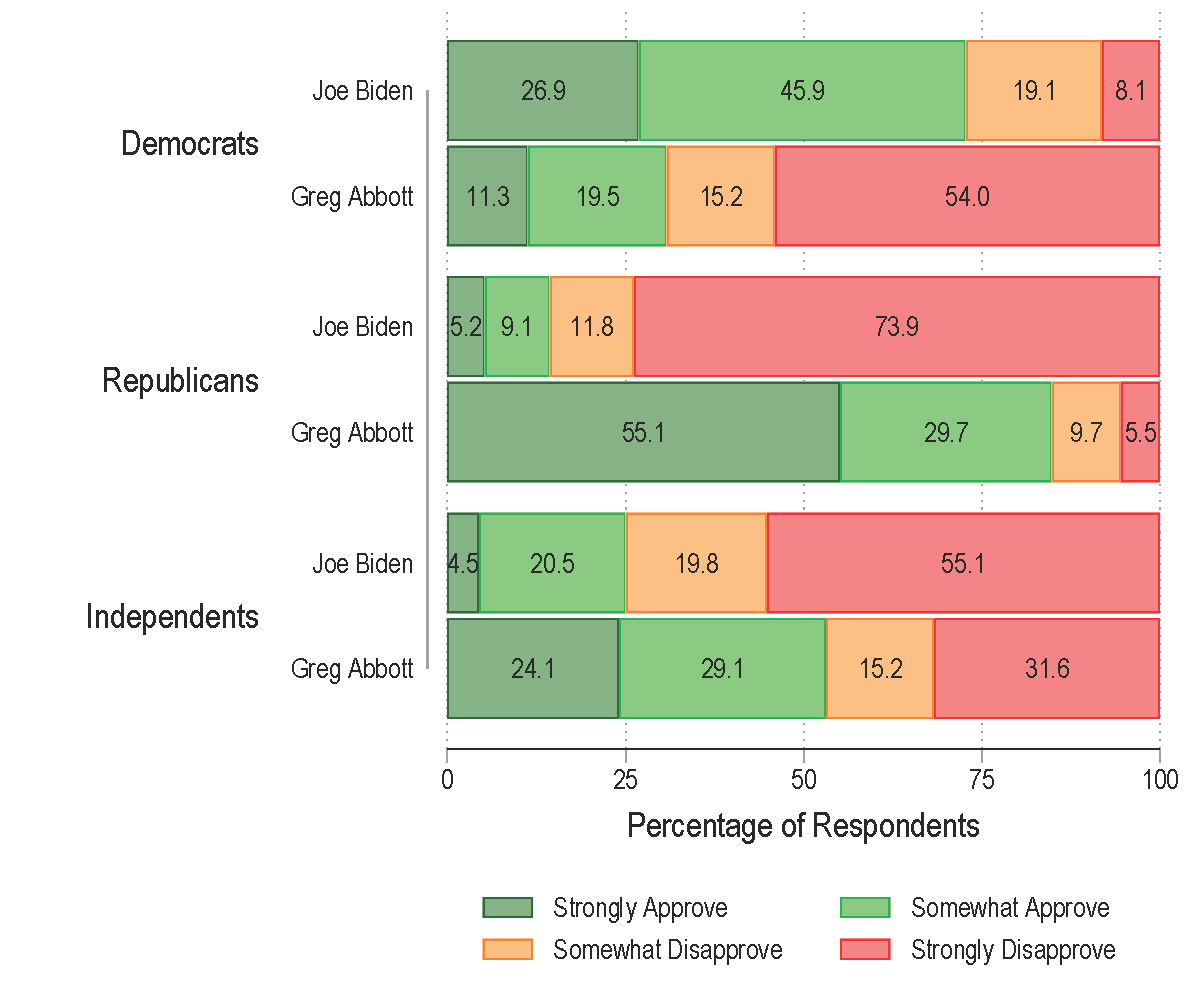
Support for how President Joe Biden and Texas Gov. Greg Abbott handle the border differs by party identification. Republican respondents generally support more restrictive measures, while Democrats are more inclined toward less restrictive policies. Similarly, researchers found generational differences, with younger respondents (Millennials and Gen Z) exhibiting more positive attitudes toward immigration and greater support for more inclusive policies.
Approval Ratings for Handling the Border Issue by Age Group: Joe Biden vs. Greg Abbott
Highlights
- 26% of Texans approve of President Joe Biden's border policy, while 57% approve of Texas Gov. Greg Abbott’s border policy.
- Among Texas Democrats, 73% approve of President Joe Biden’s policy, while only 31% approve of Texas Gov. Greg Abbott’s border policy.
- Among Texas Republicans, 85% approve of Texas Gov. Greg Abbott’s border policy, while only 14% approve of President Joe Biden’s border policy.
- Except for respondents living in Austin, Texas Gov. Greg Abbott’s handling of the border has more support than Biden’s border policy.
- Republicans have expressed 52% more support than Democrats for making illegal immigration a state crime and empowering Texas law enforcement to arrest illegal immigrants (88% vs. 36%).
- 82% of Republicans, compared to 45% of Democrats, have expressed support for spending $3.5 billion in state tax dollars annually on border security.
- 83% of Republicans are somewhat concerned or very concerned about illegal voting in Texas. For Democrats, the percentage is 46.3%.
Read Report Six to learn about where likely Texas voters stand on immigration policy and border security-related issues, including differences of opinion when considering demographics and partisanship.
Media Release, August 15, 2024
Report Seven. Texas Trends Survey: A Second Look at the 2024 Election
Due to extraordinary circumstances including Joe Biden’s decision to drop out of the 2024 presidential race and the Democratic Party’s subsequent nomination of Kamala Harris as well as the impact of Hurricane Beryl on Texas, a second wave of the Texas Trends survey was fielded between August 5 and August 16, 2024. A substantial portion of the respondents from the June-July survey were reinterviewed along with additional respondents to ensure a representative statewide sample population. This election-focused report focuses on the subset of respondents (1,365 total, with a margin of error of 2.65%) who indicated that they were likely to vote in the November 2024 election.
Highlights
- In the 2024 presidential election, 49.5% of Texas likely voters intend to vote for Republican Donald Trump, 44.6% for Democrat Kamala Harris, 2.0% for Independent Robert F. Kennedy, Jr., 0.7% for the Green Party’s Jill Stein and 0.5% for Libertarian Chase Oliver, with 2.7% undecided.
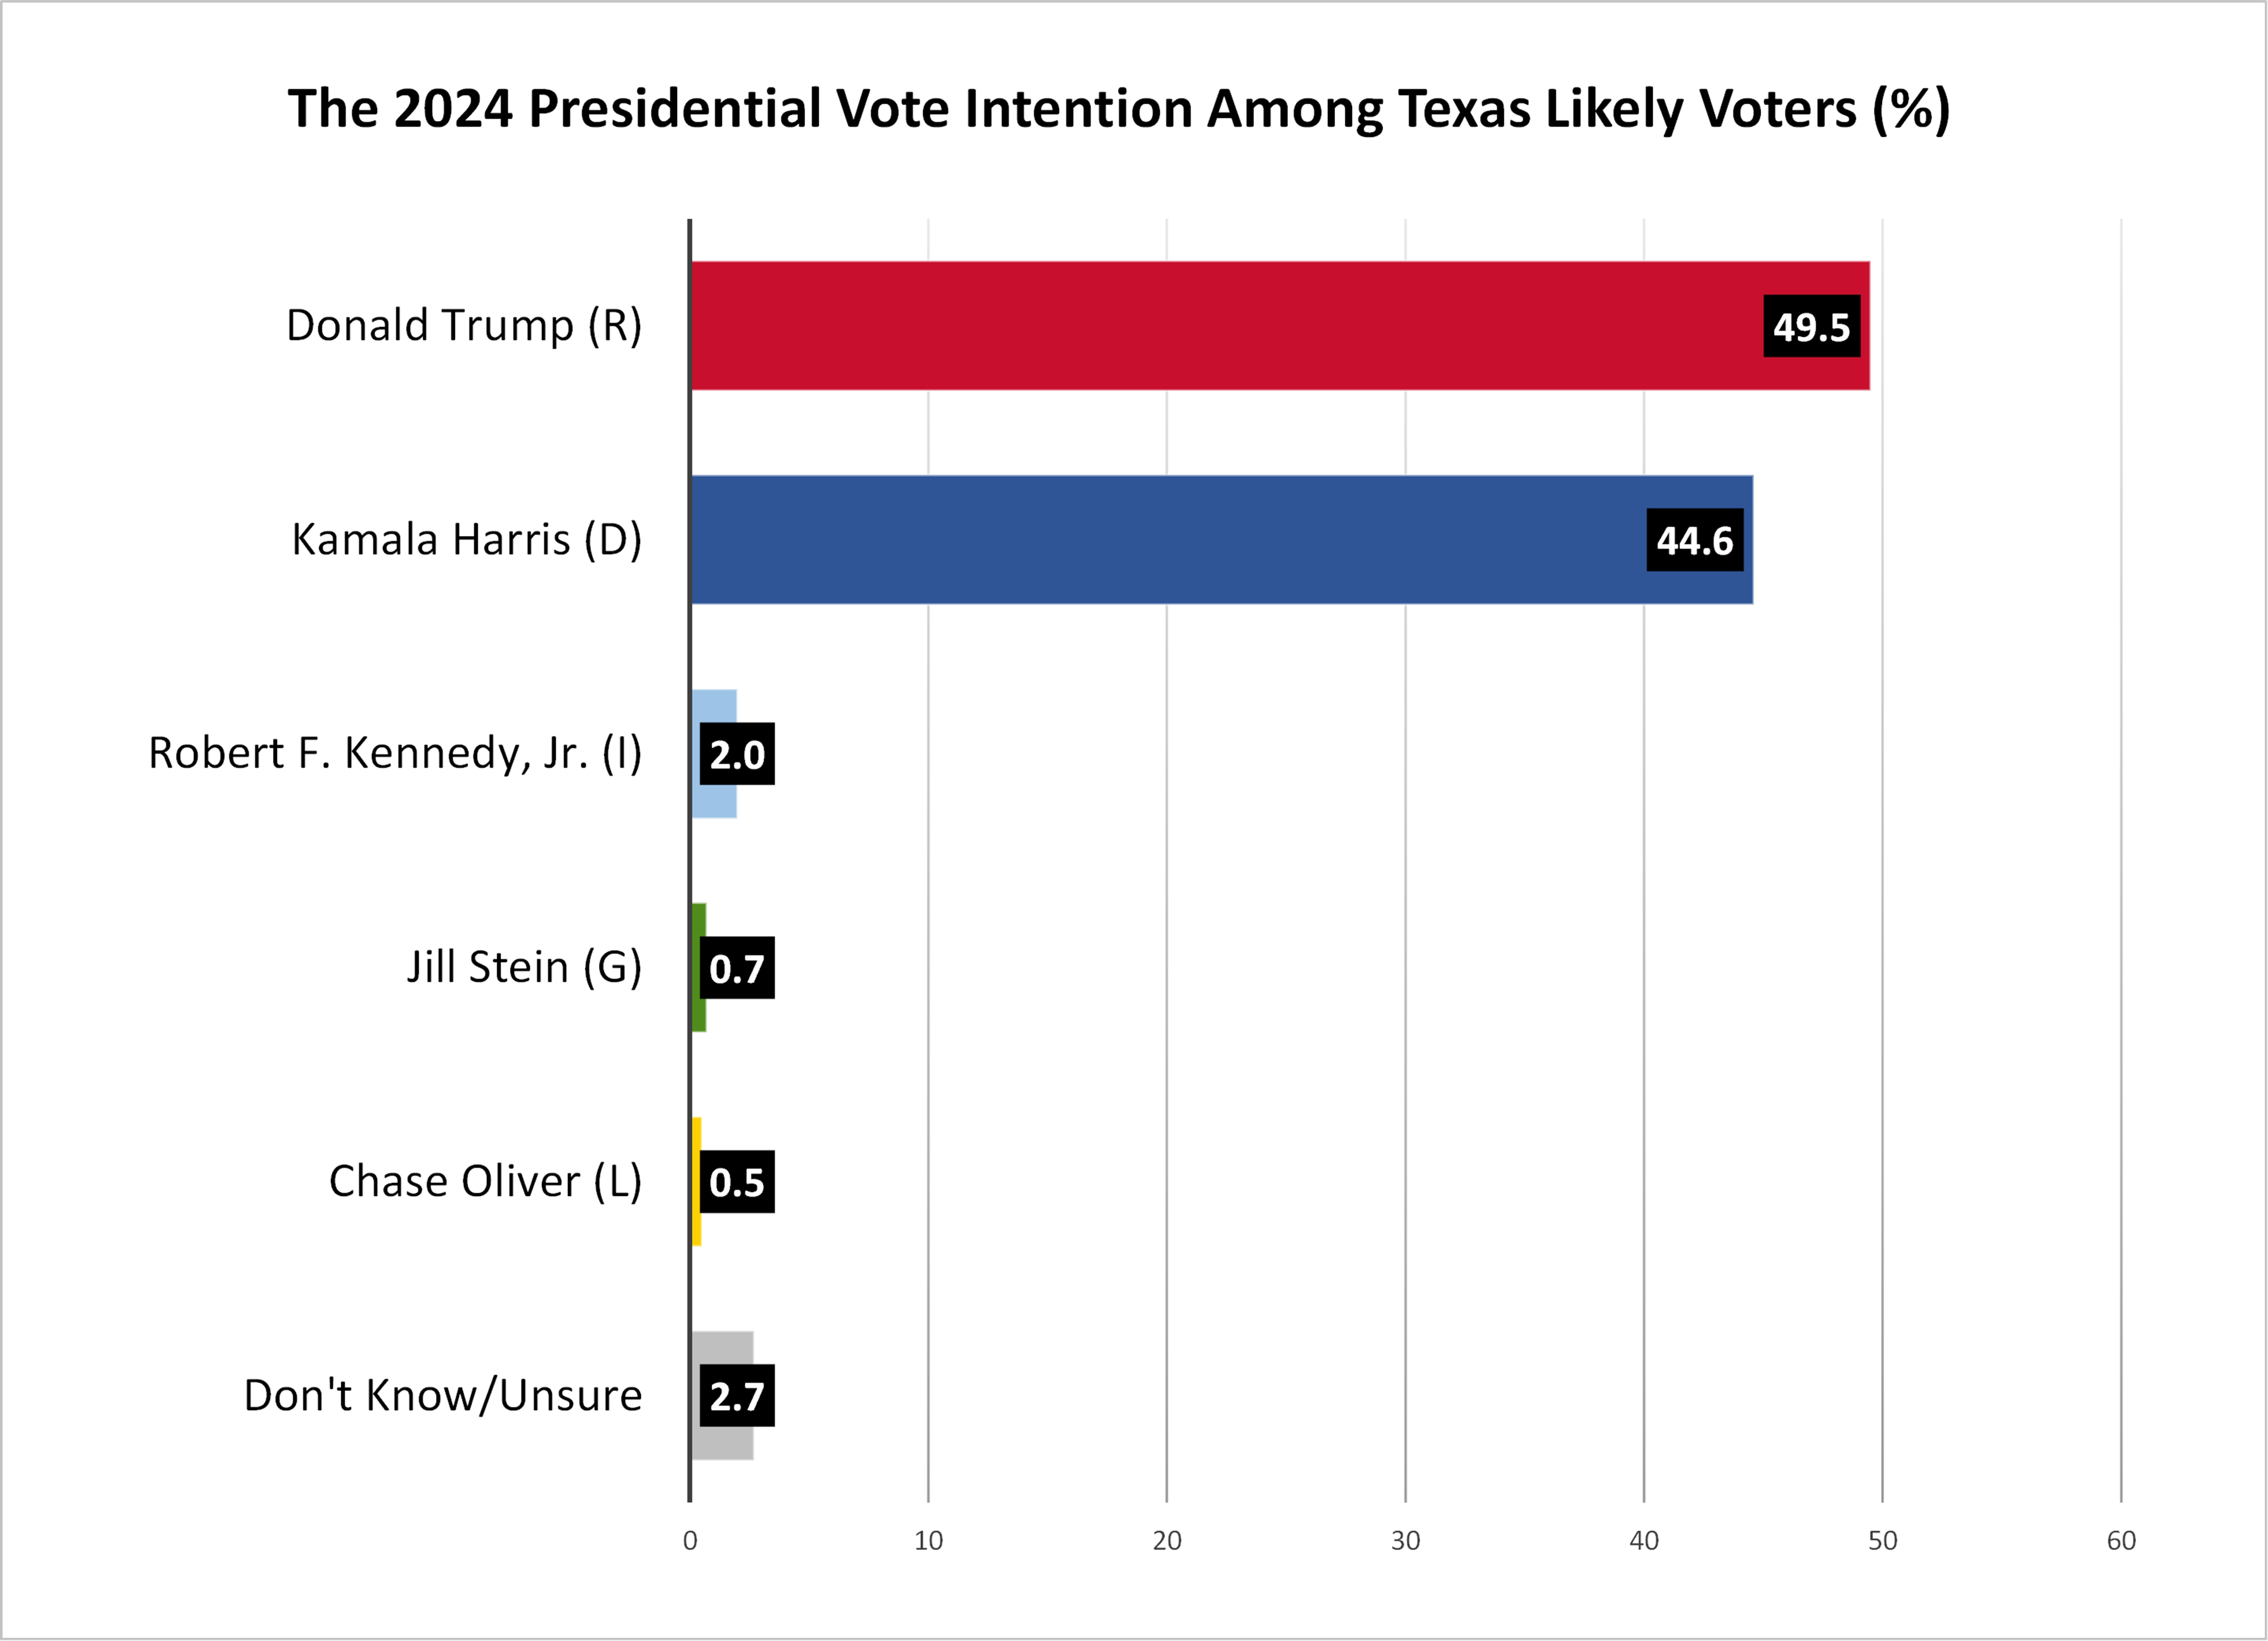
- Kamala Harris’s August vote intention is 4.3 percentage points higher than Joe Biden’s was in the June survey (44.6% vs. 40.3%).
- Donald Trump holds an 18 percentage point lead over Kamala Harris among men (56% to 38%), while Harris holds a six percentage point lead over Trump among women (50% to 44%).
- 47% of Latino Texans intend to vote for Donald Trump compared to 46% who intend to vote for Kamala Harris.
- 55% of Generation Z voters intend to vote for Kamala Harris, while 38% intend to support Donald Trump. In June, Biden’s vote intention among Generation Z was 39%, while Trump’s was 42%.
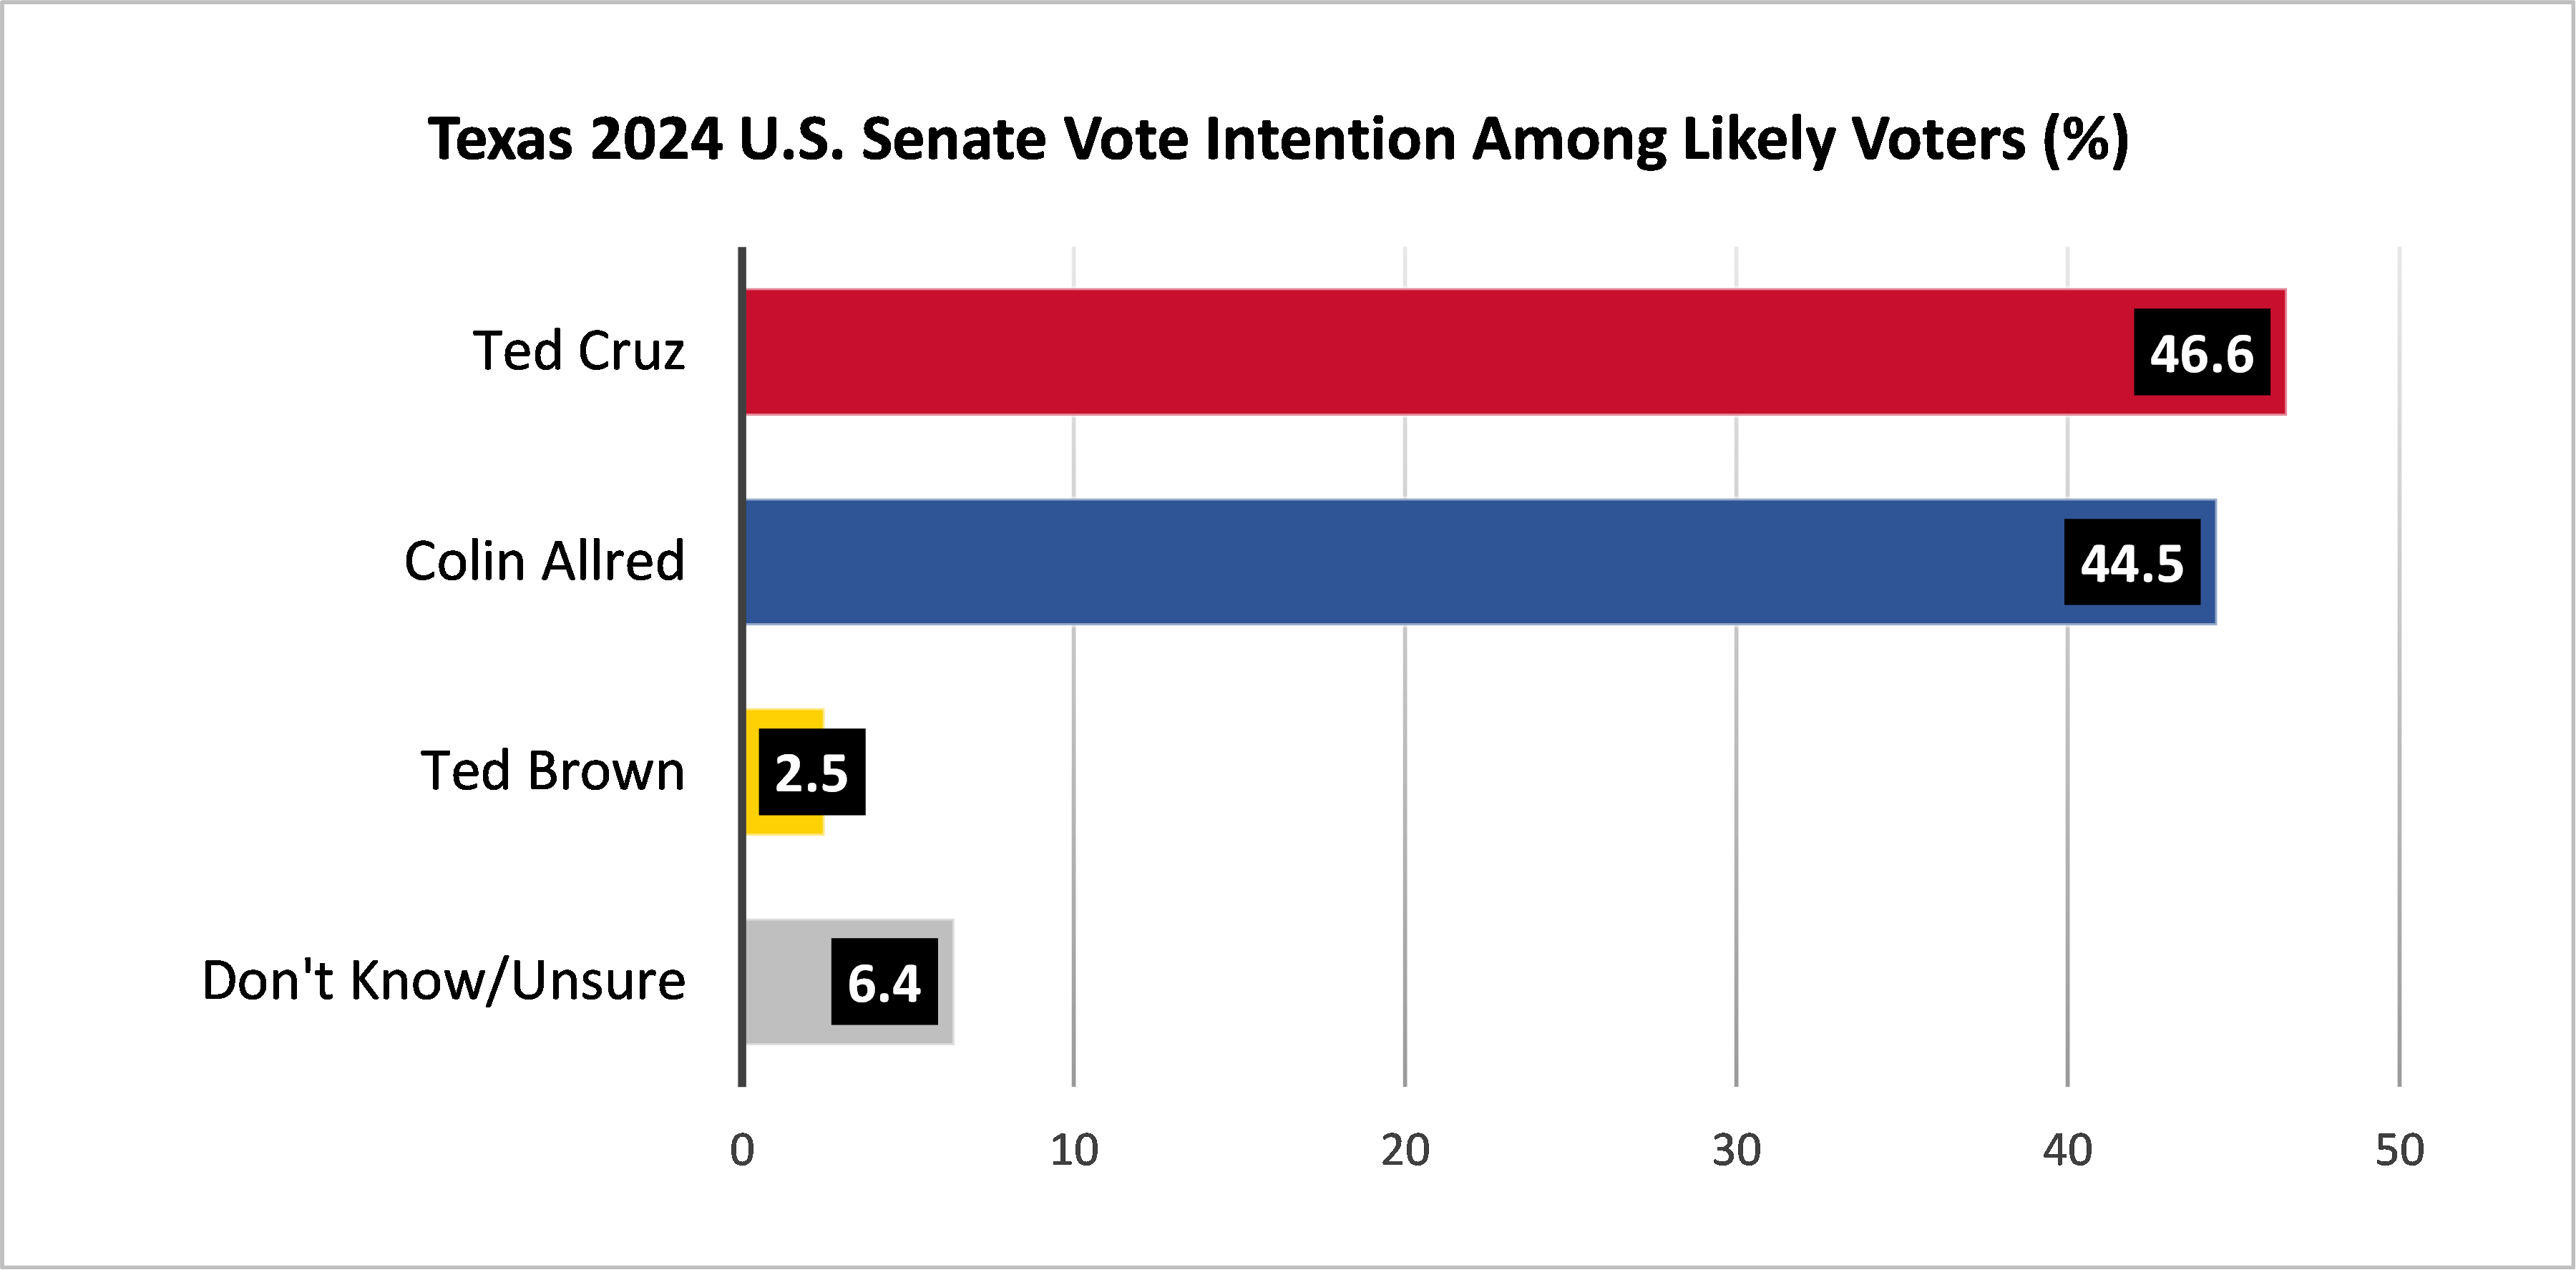
- In the 2024 Texas U.S. Senate election, 46.6% of Texas likely voters intend to vote for Republican Ted Cruz, 44.5% for Democrat Colin Allred and 2.5% for Libertarian Ted Brown, with 6.4% undecided. These proportions are essentially unchanged from those in the June survey.
- Ted Cruz holds a 13 percentage point lead over Colin Allred among men (52% to 39%), while Allred holds a seven percentage point lead over Cruz among women (49% to 42%).
- 46% of Latino Texans intend to vote for Colin Allred, while 40% intend to vote for Ted Cruz.
- 58% of Generation Z intends to vote for Colin Allred, while 31% intend to vote for Ted Cruz.
- 49% of Texas likely voters have a favorable opinion of Donald Trump (35% very favorable), while 50% have an unfavorable opinion of the former president (44% very unfavorable).
- 48% of Texas likely voters have a favorable opinion of Kamala Harris (31% very favorable), while 51% have an unfavorable opinion of the Vice President (43% very unfavorable). In June, Harris’s net favorability rating (percentage favorable minus percentage unfavorable) was -14% compared to -3% in August.
- The net favorability ratings (percentage favorable minus percentage unfavorable) ranged from highs of 11% (Allred), 9% (Governor Greg Abbott) and 8% (Lieutenant Governor Dan Patrick) to lows of -13% (Biden) and -3% (Harris), with Cruz (1%), Walz (1%), Vance (0%) and Trump (-1%) in between.
Read Report Seven to learn about where likely Texas voters stand on the 2024 candidates and officeholders, including differences of opinion when considering gender, age, race/ethnicity and partisanship.
Media Release, August 22, 2024
Report Eight. Texas Trends Survey: Climate Change
Temperature perceptions impact climate change awareness, preparedness and coping strategies. Researchers compared how Texans felt in the summer of 2024 to the previous summer, learning that Texans are increasingly perceiving hotter summer temperatures. Those who are more vulnerable are disproportionally more affected by experiencing hotter temperatures. Similarly, those who have been more affected by blackouts because of major extreme weather events are feeling hotter summers.
Highlights
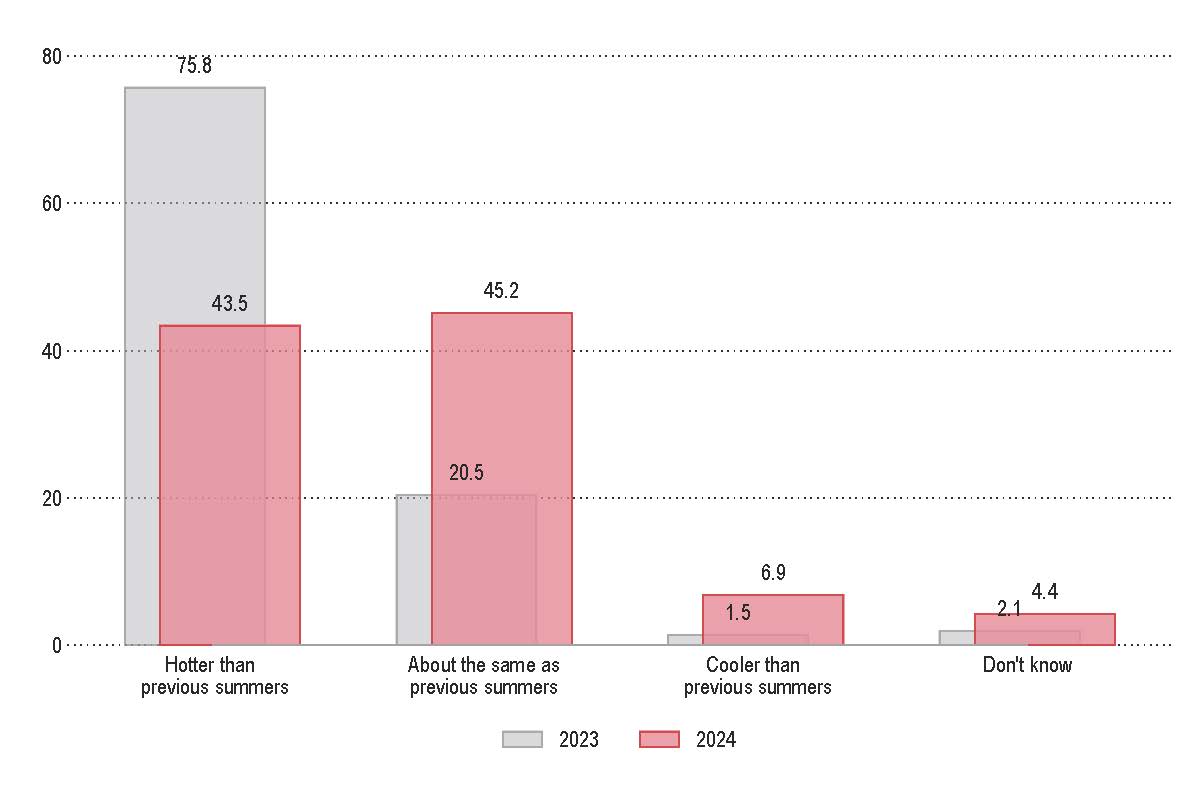
- In 2023, 75.8% of Texans believed the summer of 2023 was hotter than the previous summer. In 2024, 43.5% of Texans said the summer of 2024 was even hotter than the summer of 2023, and 45.2% said it was about the same.
- Among those who have not experienced blackouts in recent major extreme weather events, 37% think this summer is hotter than previous summers. This number changes to 47.5% for those who have experienced two or more blackouts.
- 7% of Hispanic respondents reported experiencing hotter temperatures compared to 51.2% of Blacks and 36.8% of Whites.
- Over half of the respondents belonging to the lower income bracket (52.7%) said they have experienced a hotter than usual summer, compared to 30.2% in the higher income bracket.
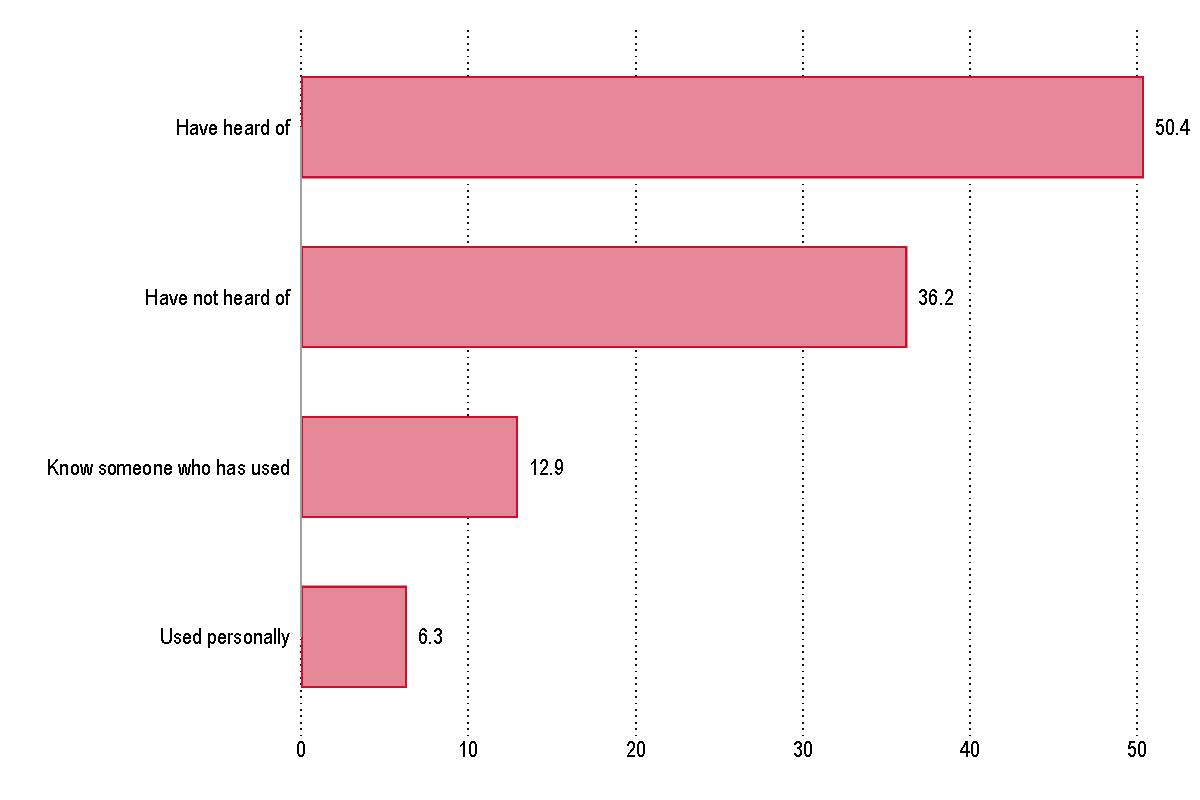
- Half of the respondents (50.4%) said they have heard of cooling centers before, 36.2% indicated they have not heard of them, 12.9% know someone who has used them before, and only 6.3% have personally used them.
- Regarding community changes, 37.5% of Texans believe that the number of people concerned about the risks of extreme weather events is increasing. About a third of Texans (33.6%) believe the number of people taking steps to protect homes from extreme weather is increasing. In comparison, about a fifth (20.4%) think the support for using tax money to protect the community from extreme weather is rising.
During or after a natural disaster, have you ever used or know someone who has used or heard about a colling center?
Read Report Eight to learn where Texans stand on climate perceptions and community coping strategies, including differences of opinion based on demographics and partisanship.
Media Release, August 28, 2024