| Subdisciplines
| Syllabus | Mascot
| Home | Exam #1
| Q & A | Course
Main page | Related Links | Research | Resources | E-mail
addresses |
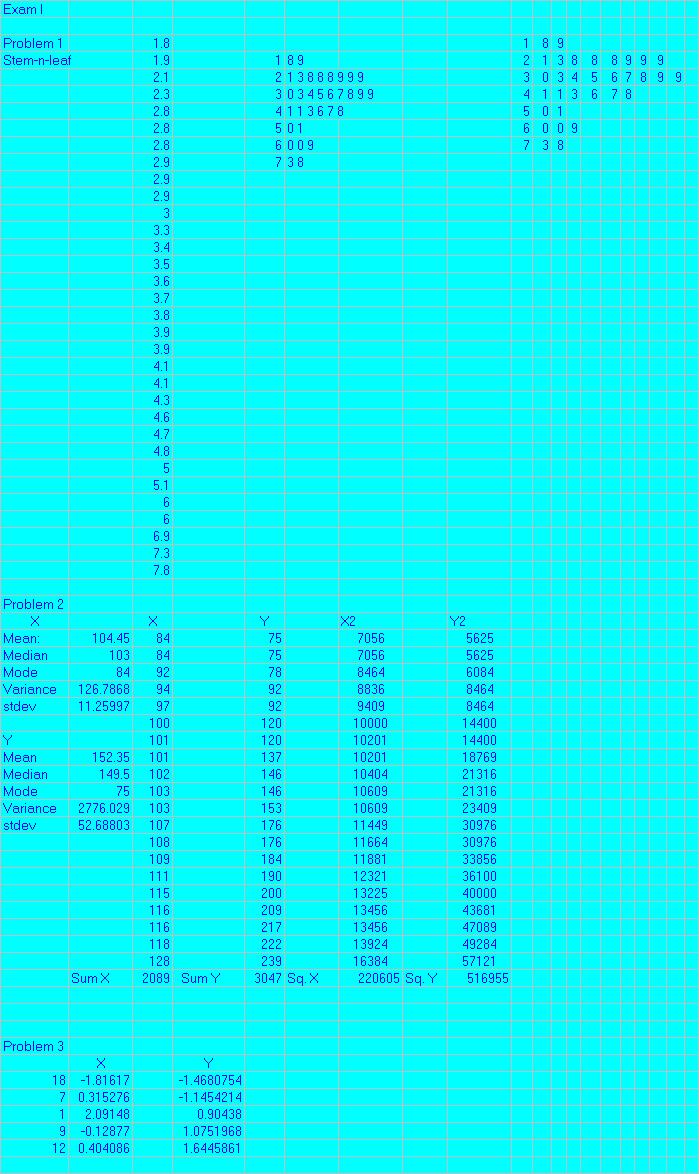
Exam #1 Questions and Answers
Questions
Write your answers on this page, use the second page for graphs and
charts.
1. The following data set shows the number of employed, 16 years or
older, over the years 1948-1979. (Rounded to "millions").
a) Construct a stem and leaf plot for the data.
b) What is the mean? ________ What is the median? _______
(total pts: 15)
2.3, 1.9, 2.8, 3.9, 3.8, 2.8, 4.8, 7.3, 3.6, 1.8, 2.9, 4.7, 3.4, 2.8,
4.3, 6.9, 3.3, 3.5, 4.6, 3.9, 2.9,
4.1, 5.1, 6.0, 2.1, 2.9, 3.7, 4.1, 3.0, 5.0, 7.8, 6.0
2. The following data sets show the IQ and achievement test scores for
20 third graders. a). Compute means, medians, modes, variances, & standard
deviations for both variables. SHOW ALL COMPUTATIONS, use the back of this
page if necessary (total pts: 50)
Student IQ Achievement IQ ACHSCR
1
128
200
_______ _______
2
111
190
3
94
176
_______ _______
4
116
217
5
103
146
_______ _______
6
101
153
7
108
92
_______ _______
8
107
176
9
103
209
_______ _______
10
118
184
11
101
146
12
109
239
13
116
120
14
84
78
15
100
222
16
102
120
17
115
137
18
84
75
19
97
92
20
92
75
3. Compute the z-scores for students 18, 7, 1, 9, 12 on both variables.
SHOW ALL COMPUTATIONS - use the back of this page if necessary (total pts:
35)
18 = ______ 7 = ______ 1 = ______ 9 =______ 12 = ______ 4.
Extra credit: 15 pts possible (5 + 5 + 5) a) Draw frequency polygon
data set 1. b)
Draw graphs (your choice) for the two variables in data set 2. c)
In words, describe the relationship between the two variables in data
set 2 in general, and student 12 in particular. 1a)
STEM AND LEAF PLOT 4a)
EXTRA CREDIT (Use line for chart) _____________________________________________________
4b) EXTRA CREDIT (Use lines for charts)
Answers
These answers were calculated with Microsoft Excel.
We would like to thank Anne Kirkpatrick for calculating these answers.
This page is maintained by
William Fuller
| Subdisciplines
| Syllabus | Mascot
| Home | Exam #1
| Q & A | Course
Main page | Related Links | Research | Resources | E-mail
addresses |