New Statistical Handbook - University of Houston
Skip to main content

The Statistical Handbook offers comprehensive, longitudinal data for the university and by college and department. Take advantage of the provided filters to slice the data.

The download button at the bottom can be used to export images and PDFs for each dashboard. You may also download data tables to Excel by clicking on a table and then selecting Crosstab using the download feature.

Whose House? Living and Studying in the Houston Metropolitan Area
Fall 2015


All Students

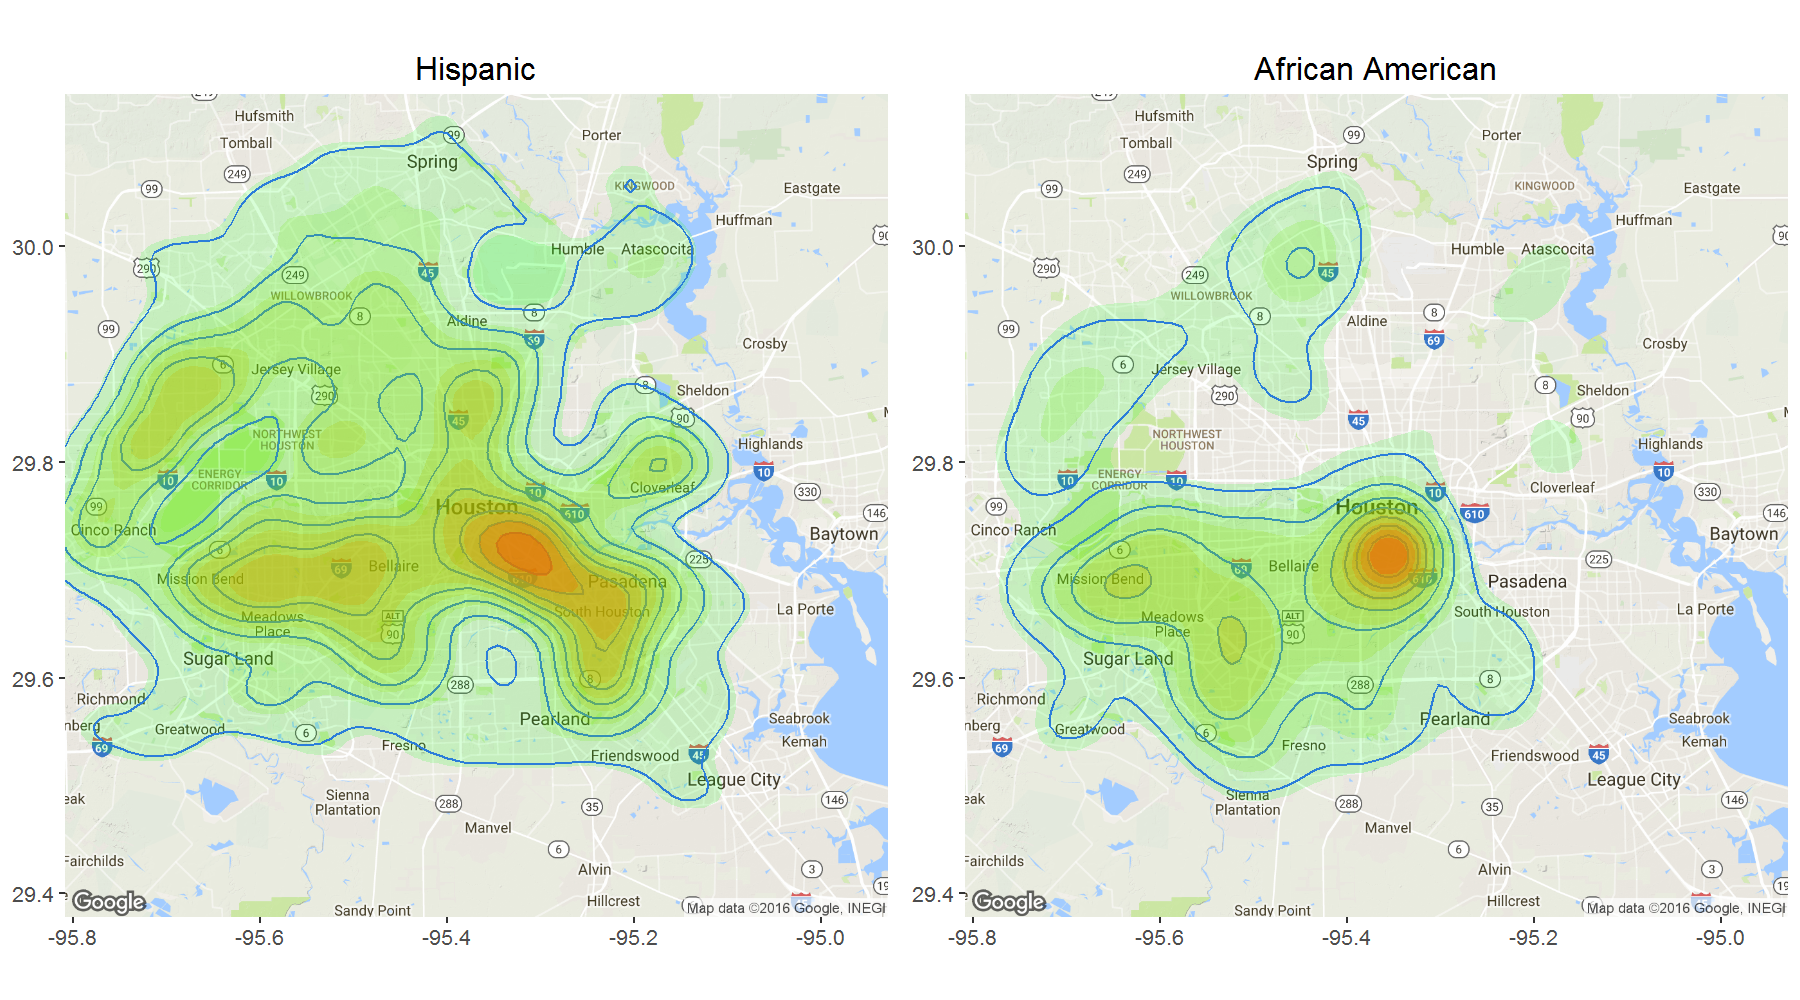
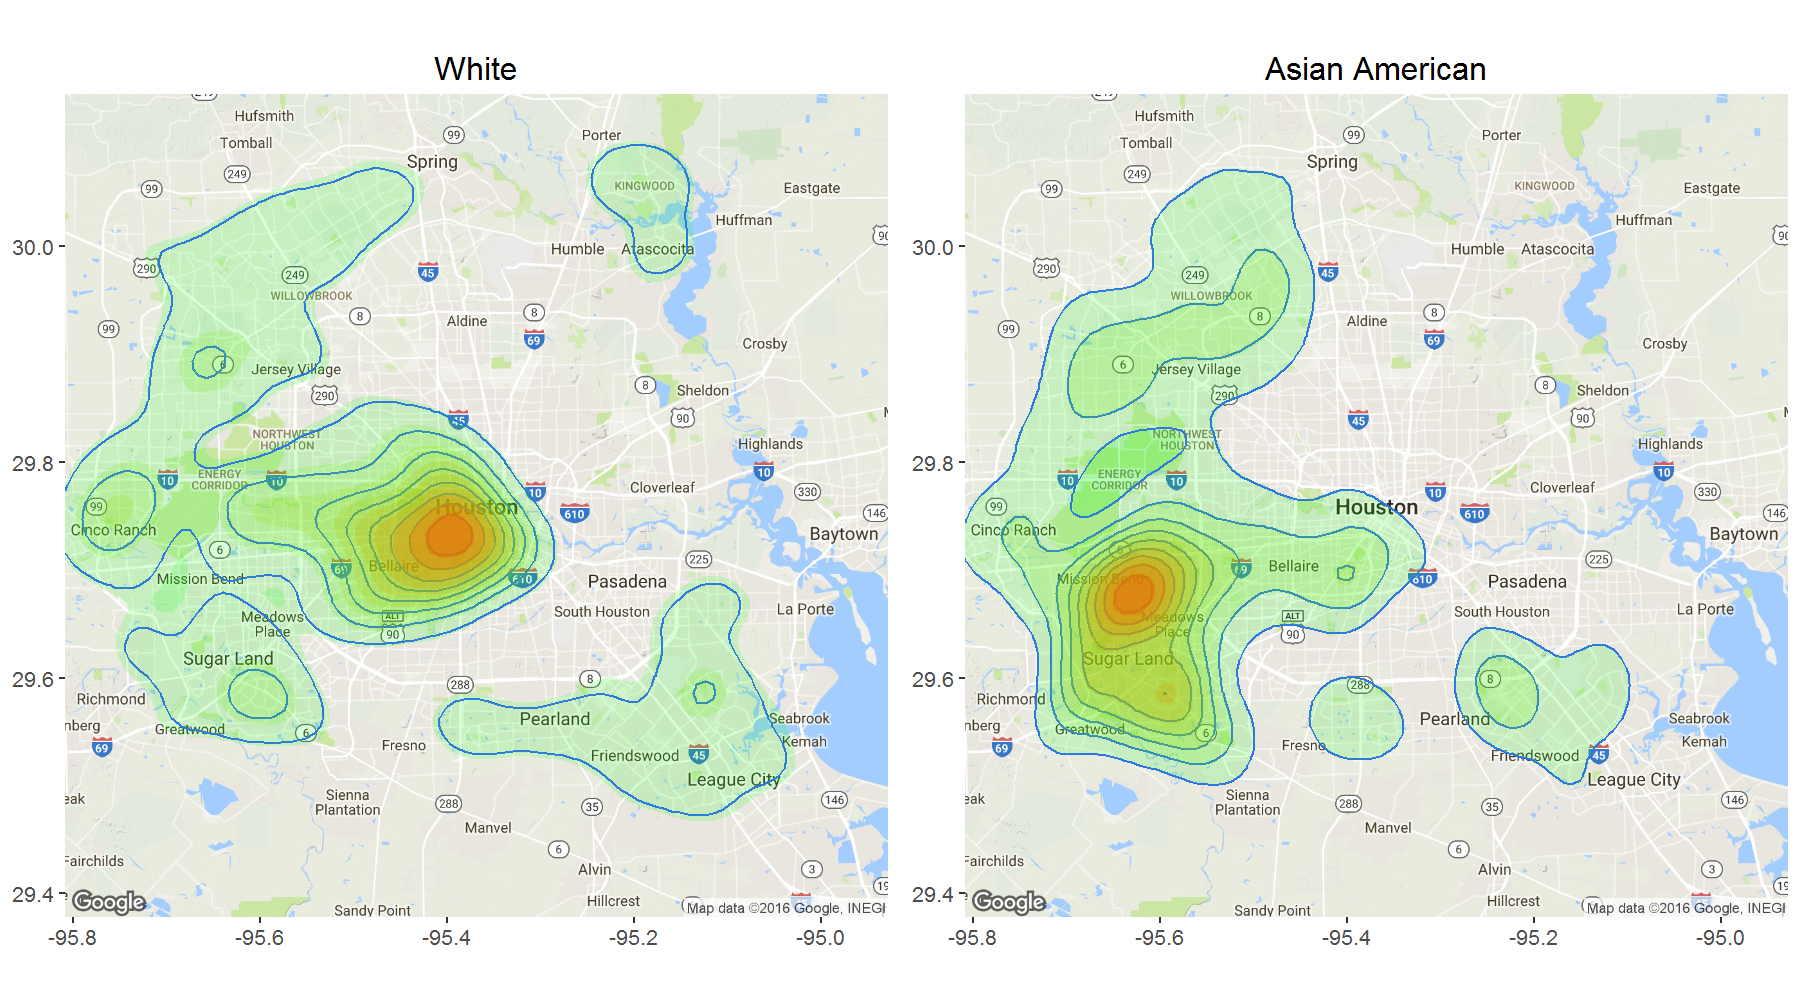
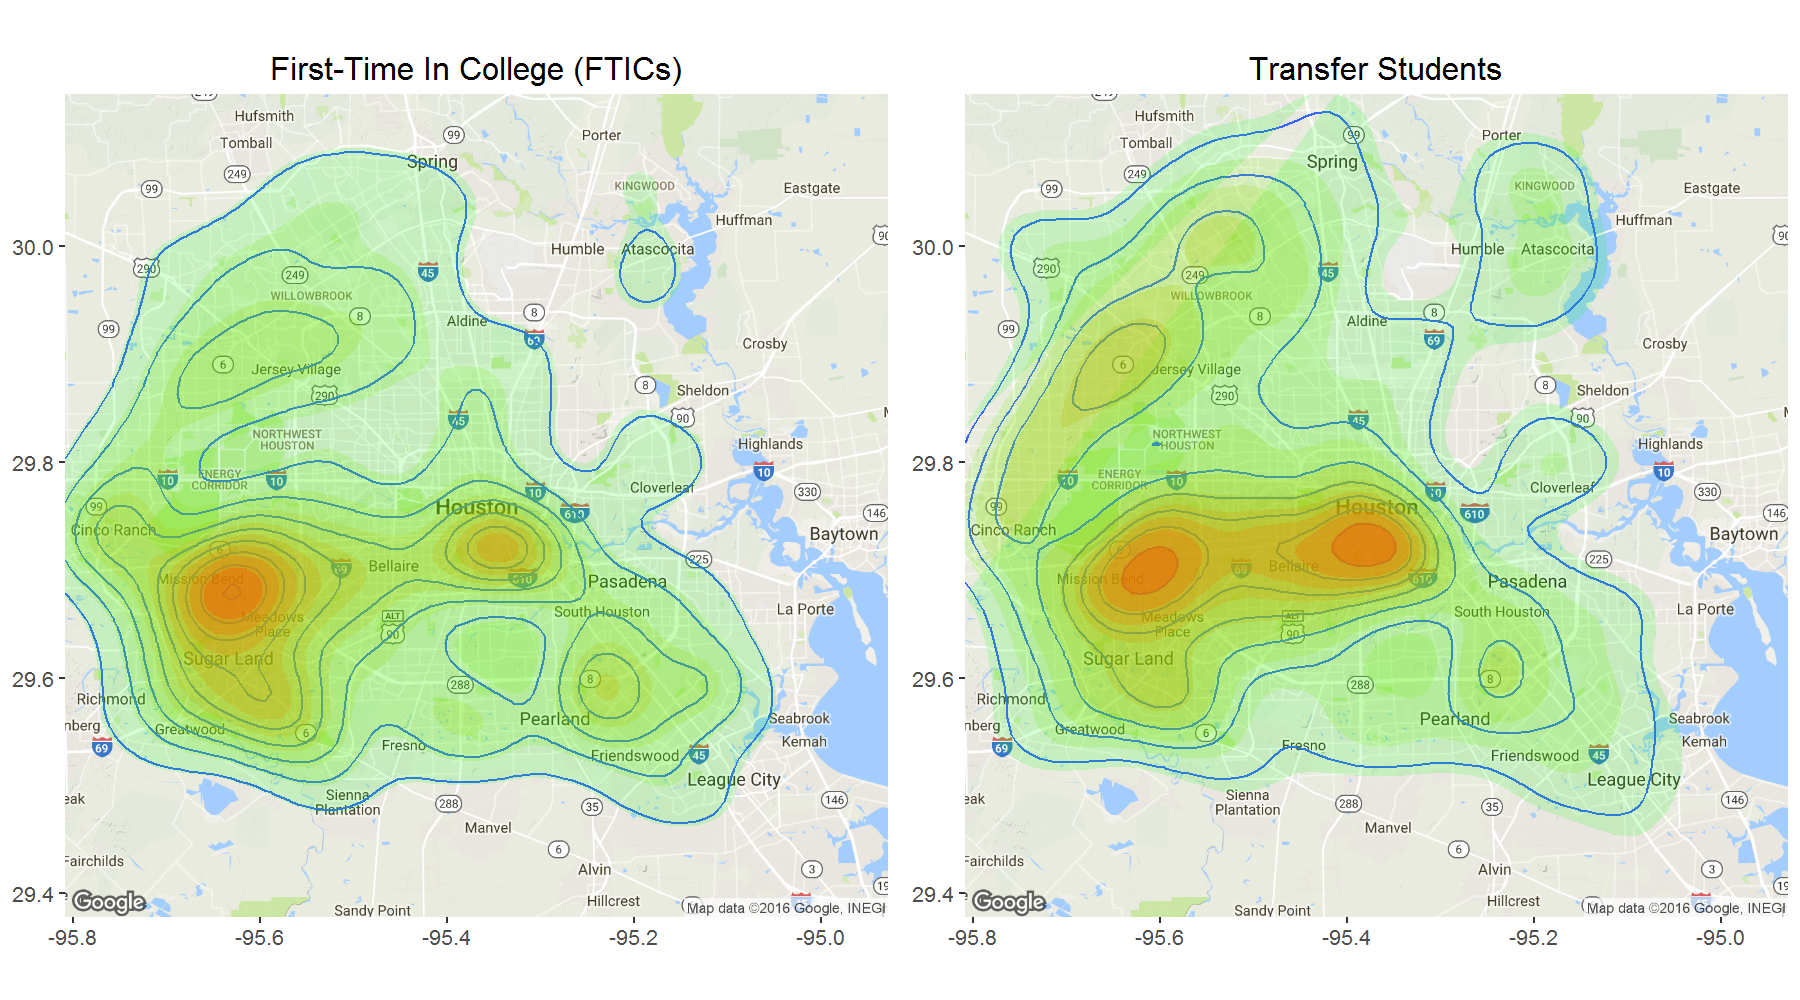
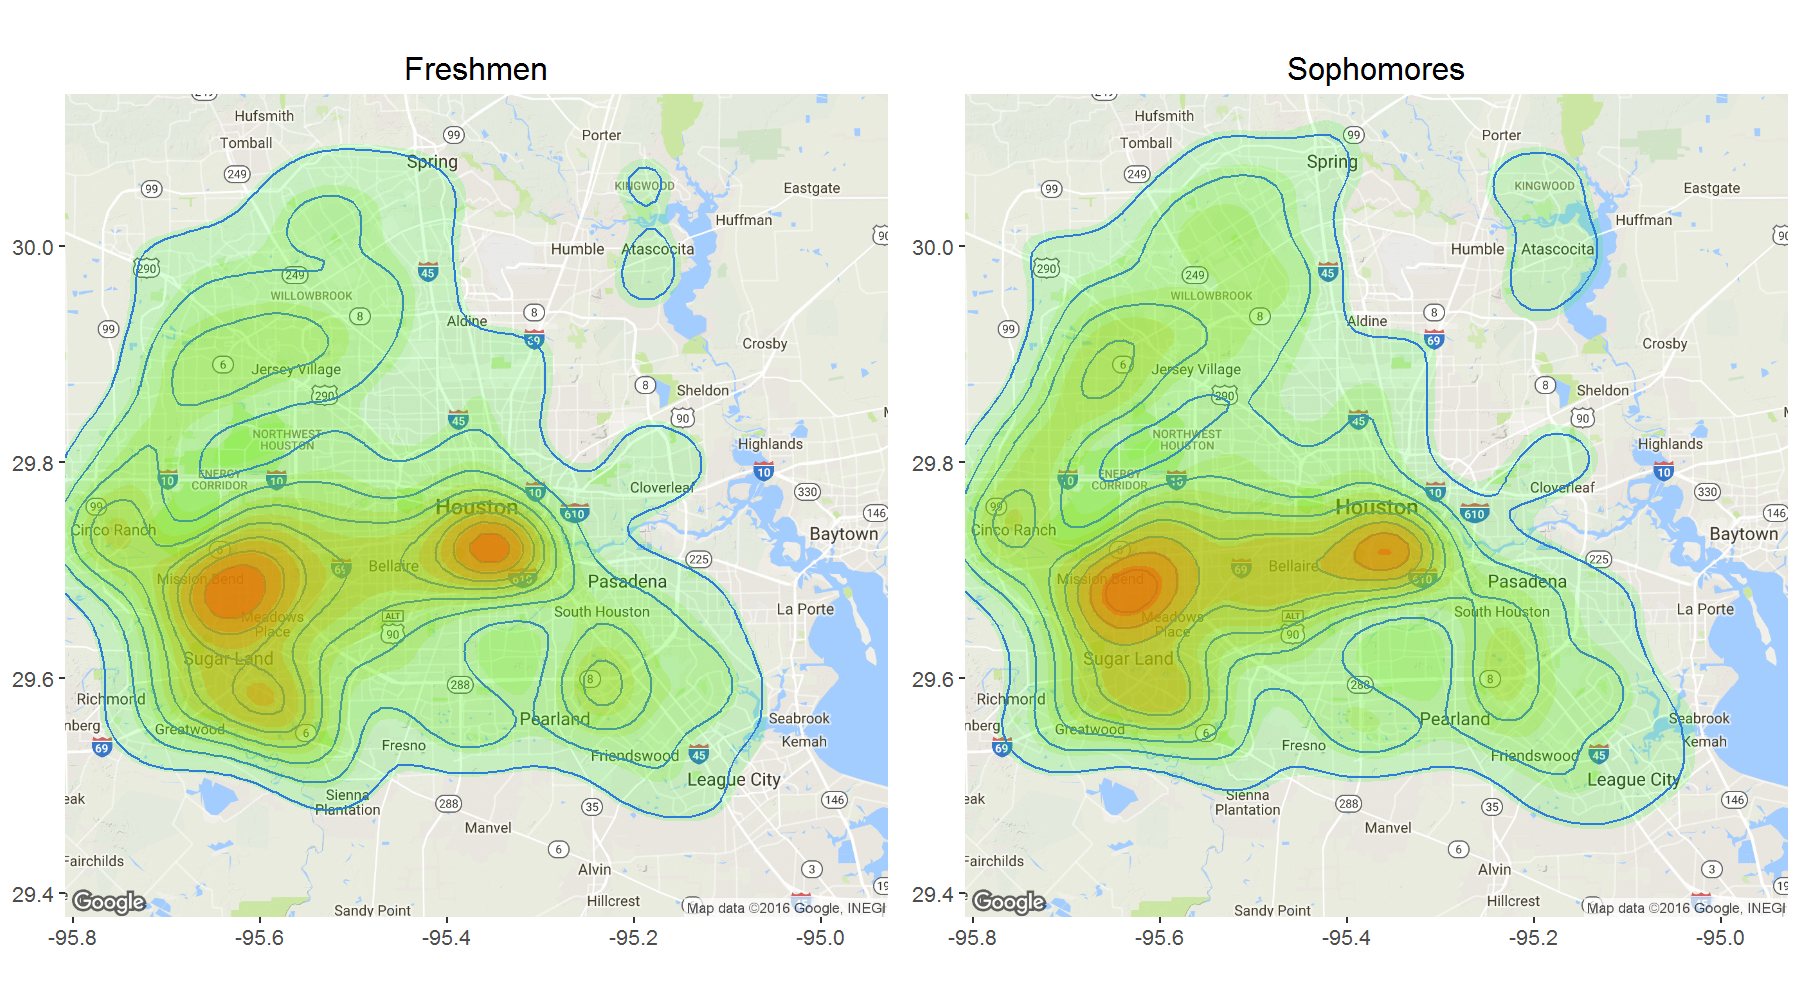
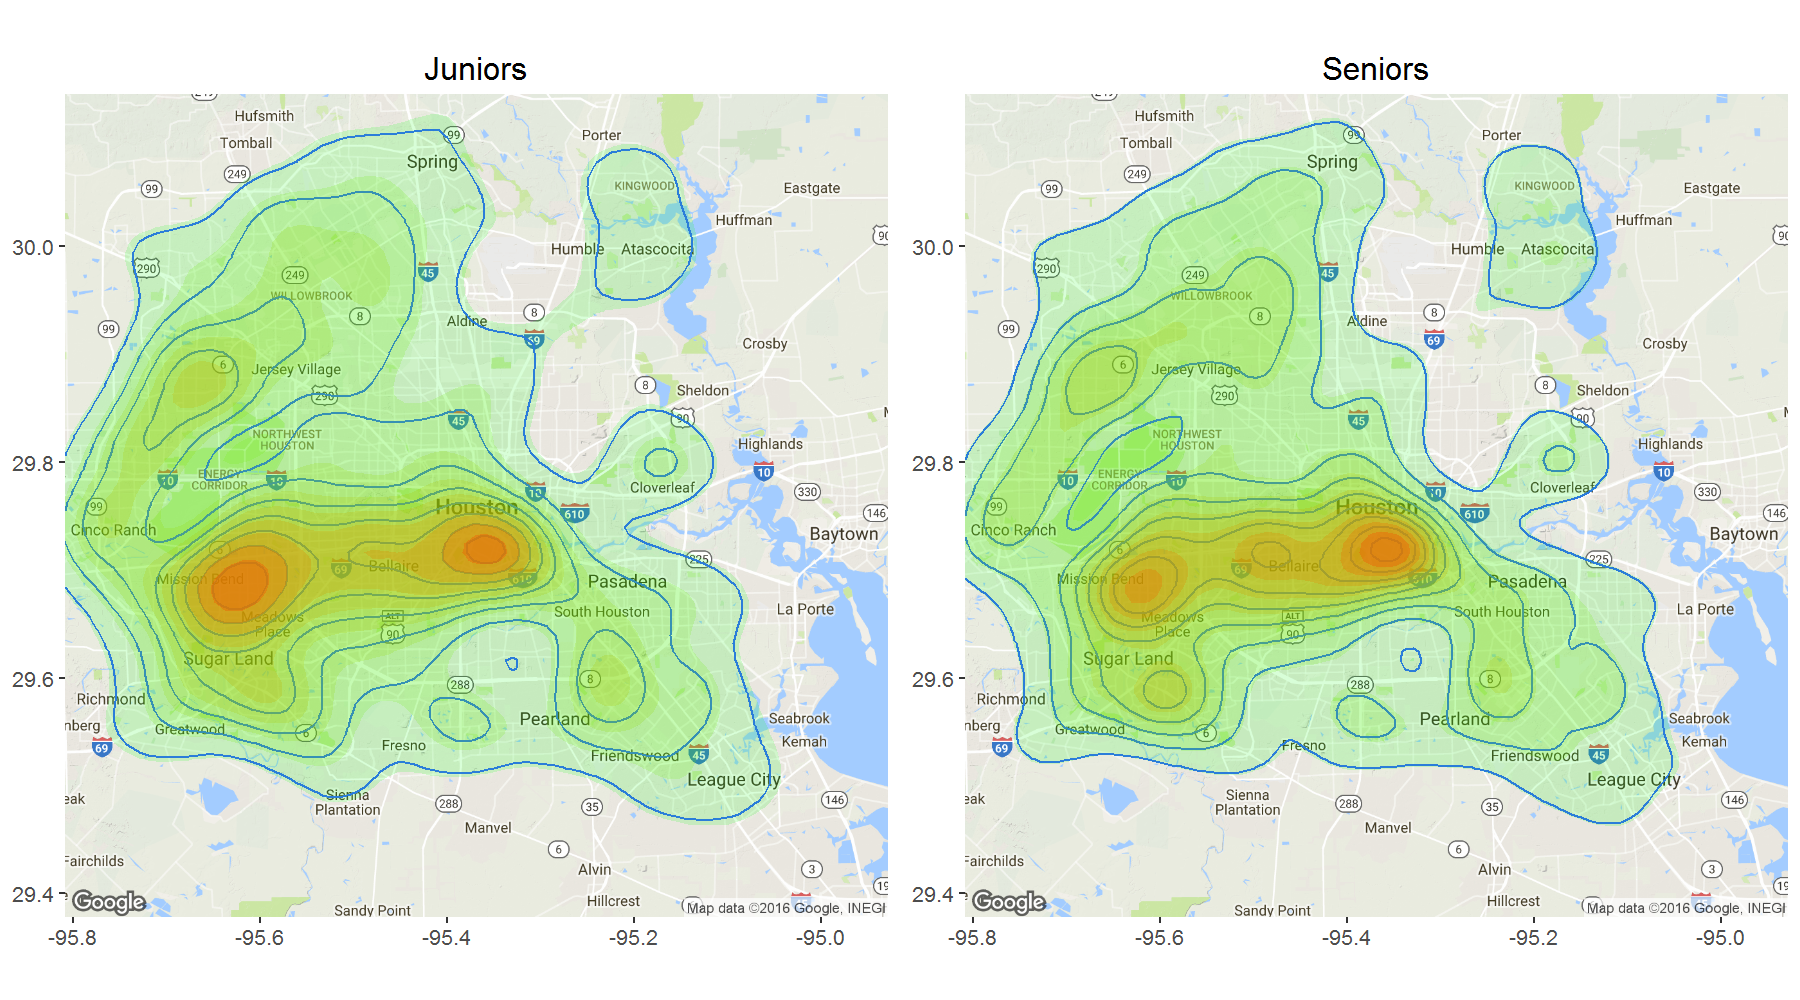
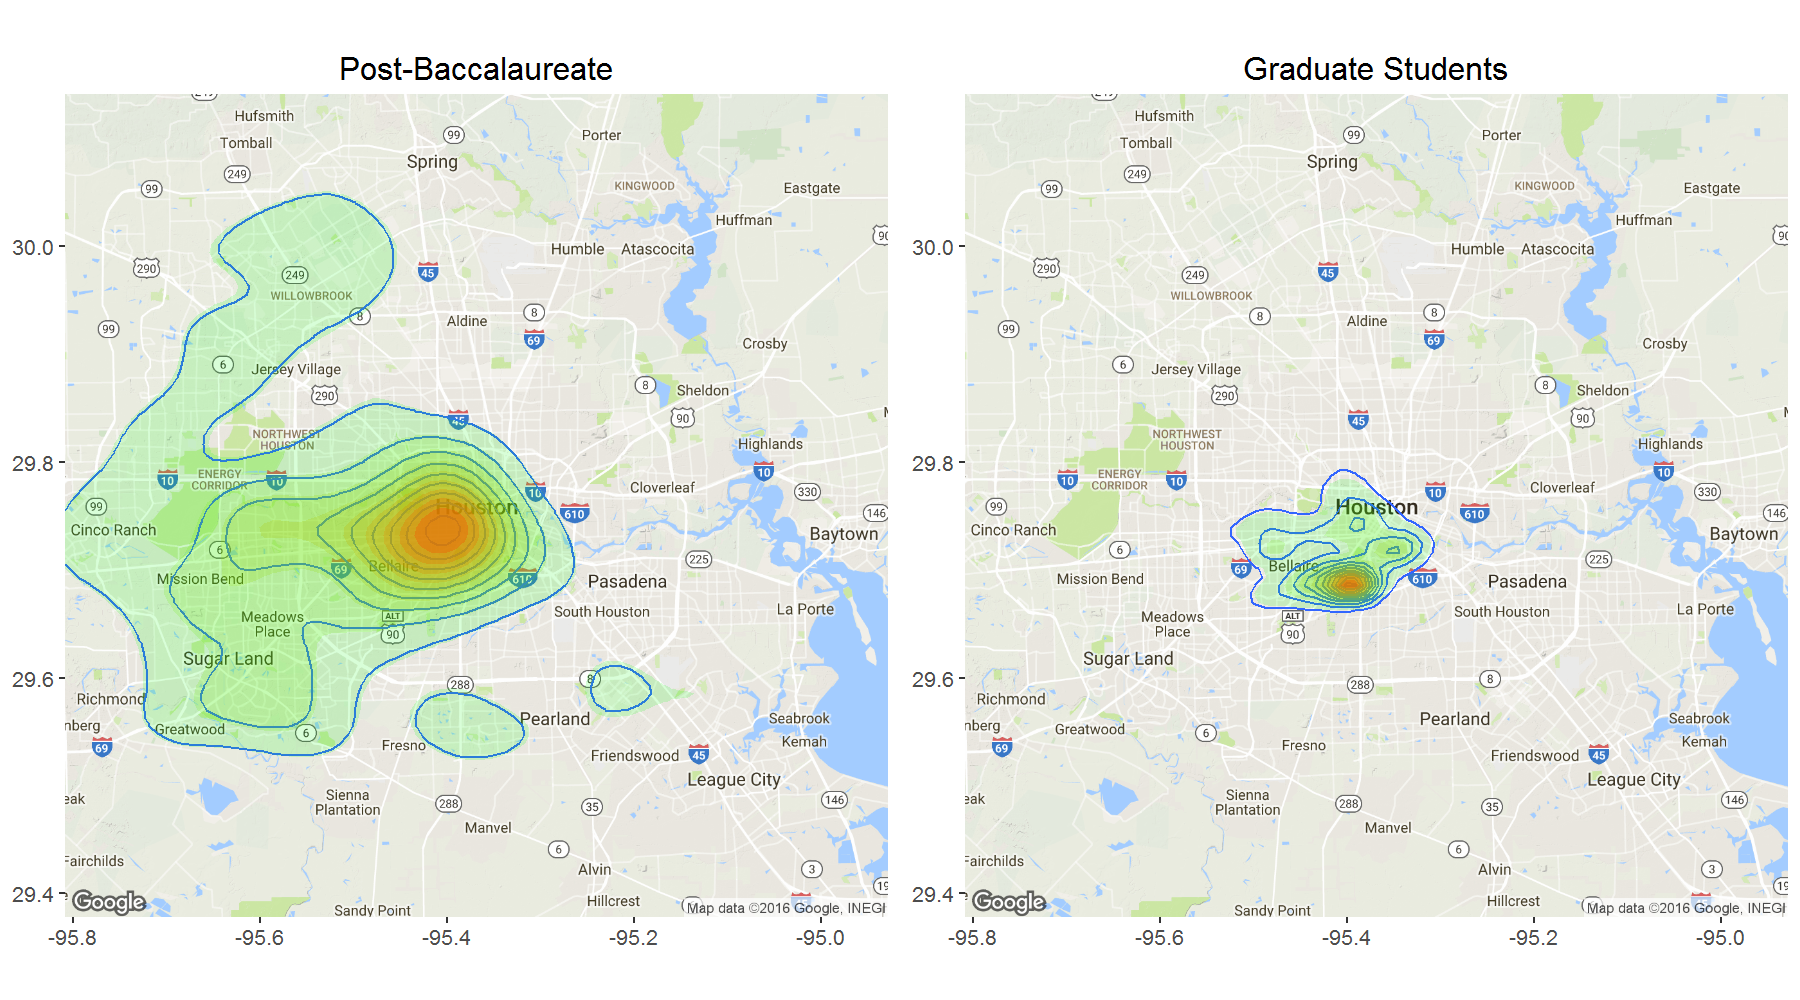
Each heat map represents the density of students living in the area. Deep red shows more density. Light green shows less density. A blue line shows the boundary of each density area.

New Students

Student Classification

Race/Ethnicity