Arif Bilal Ozer
Home | Resume | Research | Achievements
|
A METHOD FOR CONCURRENT
THERMOGRAPHIC-PHOTOGRAPHIC VISUALIZATION OF FLOW BOILING IN A
MINIChannel Arif B. Ozer, Ahmet F. Oncel, D. Keith
Hollingsworth, Larry C. Witte Department of Mechanical Engineering,
|
|
Abstract
A method is developed to capture the distribution of surface temperature while simultaneously imaging the bubble motions in diabatic flow boiling in a horizontal minichannel. Liquid crystal thermography is used to obtain highly resolved surface temperature measurements on the uniformly heated upper surface of the channel. High-speed images of the flow field are acquired simultaneously and are overlaid with the thermal images. The local surface temperature and heat transfer coefficient can be analyzed with the knowledge of the nucleation site density and location, and bubble motion and size evolution. The horizontal channel was 1.2 mm high ´ 23 mm wide ´ 357 mm long, and the working fluid was Novec 649. Optical access is through a machined glass plate which forms the bottom of the channel. The top surface is an electrically heated 76-micron-thick Hastelloy foil held in place by a water-cooled aluminum and glass frame. The heat loss resulting from this construction was computed using a two-dimensional conduction model in Fluent. The model was driven by temperature measurements on the glass plate and the aluminum frame. This model produced a corrected value for the local surface heat flux and enabled the computation of the bulk fluid temperature and heat transfer coefficient along the channel. The evolution of the heat transfer coefficient with streamwise position for single-phase laminar flow was compared to theoretical predictions for a uniform-flux boundary condition. Examples of the use of the facility for visualizing and understanding subcooled two-phase flows are presented. These examples include detailed measurements of the two-dimensional surface temperature distribution around active nucleation sites. Post-processing software allows a boiling curve to be computed for each pixel on the heated surface. Points along the curve can be associated with specific image sequences so that the roles of mechanisms such as nucleation and the sliding of confined bubbles may be discerned. |
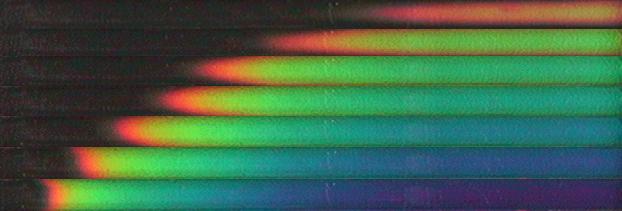
Fig. Wall Temperature Increase with Increasing Wall Heat Flux at Single-Phase Captured by Liquid Crystal Thermography
(Flow is from left to right)
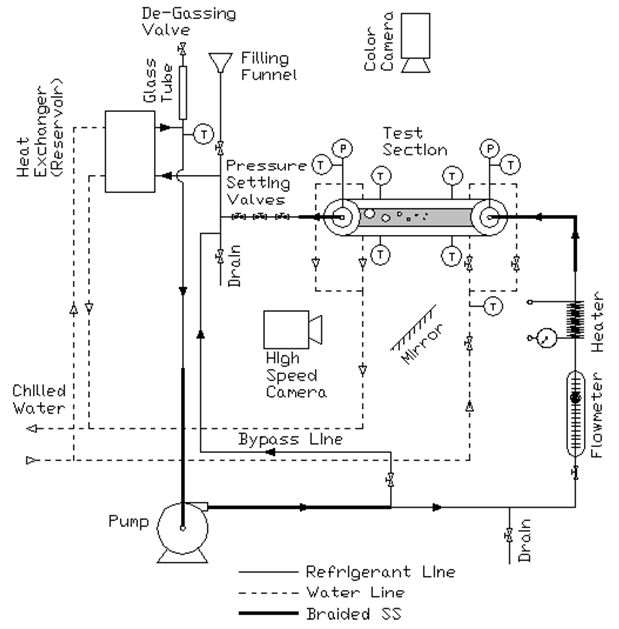
Fig. Expremintal Setup
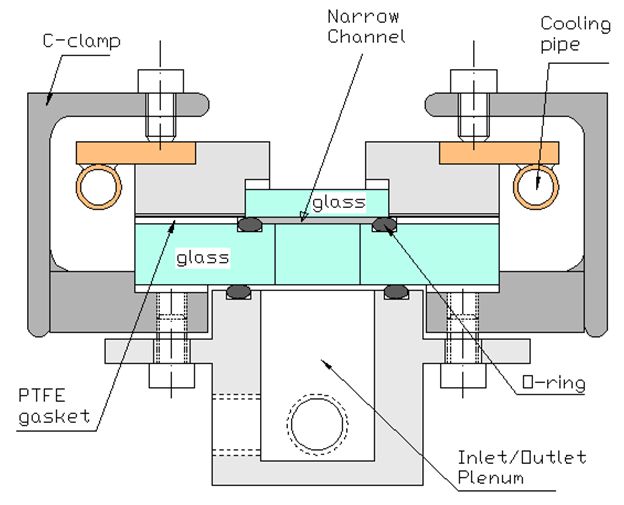
Fig. Test Section

Fig. Simulation of Temperature Distribution and Heat Loss at a Cross-section of the Test Section
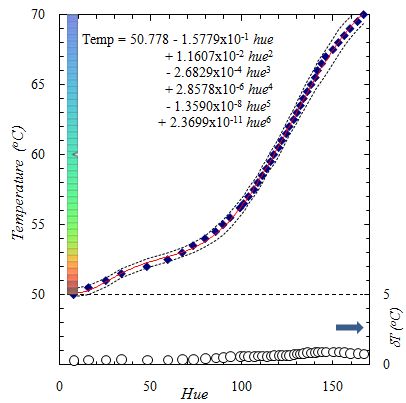
Fig. TLC Calibration Curve and Corresponding Single-Sample Uncertainty
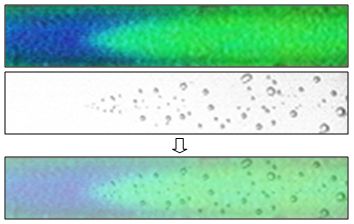
Fig. Image Overlaying
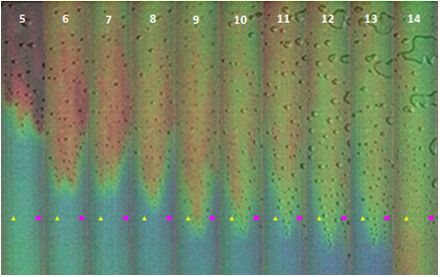
Fig. Sequence of Images with Increasing Heat Flux
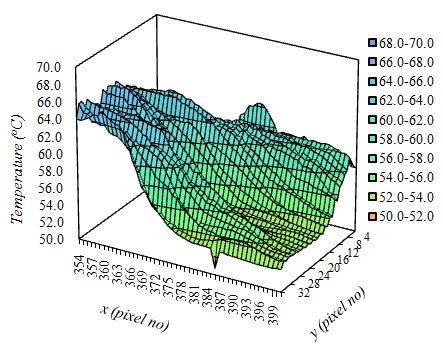
Fig. Temperature Drop at the Onset of Boiling
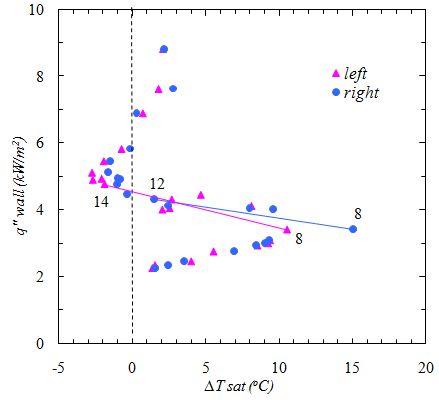
Fig. Turning Angle Phenomenon
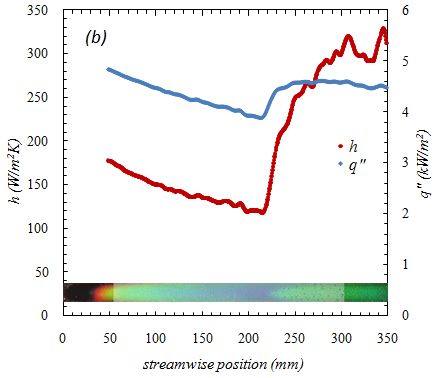
Fig. Heat Transfer Coefficient vs. Streamwise Position