Requests per hour (Node 3)
The statistics were last updated Sunday, 27 April 2008 at 9:55,
at which time the device had been up for 3 days, 22 hours, and 40 minutes.
`Daily' Graph (5 Minute Average)
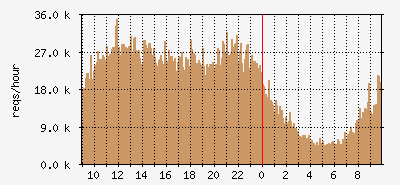
| Max In: |
34.9 kper hour
|
|
Average In: |
19.0 kper hour
|
|
Current In: |
19.8 kper hour
|
`Weekly' Graph (30 Minute Average)
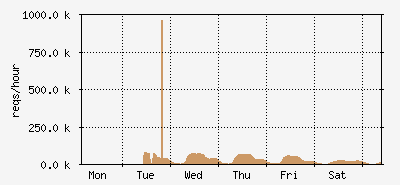
| Max In: |
964.7 kper hour
|
|
Average In: |
36.9 kper hour
|
|
Current In: |
12.7 kper hour
|
`Monthly' Graph (2 Hour Average)
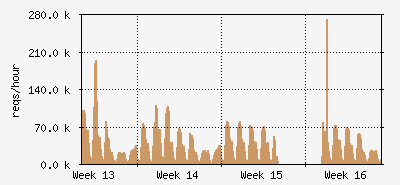
| Max In: |
271.3 kper hour
|
|
Average In: |
38.3 kper hour
|
|
Current In: |
10.6 kper hour
|
`Yearly' Graph (1 Day Average)
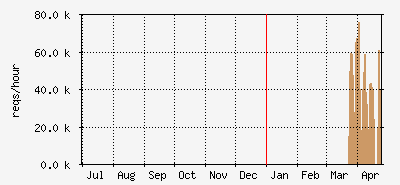
| Max In: |
76.0 kper hour
|
|
Average In: |
41.1 kper hour
|
|
Current In: |
33.5 kper hour
|
WWW.UH.EDU: View Traffic and Operation