The Earth is a three-dimensional object. To locate a particular place on Earth we can specify three pieces of information:
- latitude - degrees North or South of the Equator (taken as zero degrees)
- longitude - degrees East or West of the prime meridian (taken as zero degrees)
- elevation - distance above or below sea level (taken as zero)
A map is a two-dimensional representation of a three-dimensional object. Distortions occur in going from three-dimensions to two-dimensions and different map projections have been devised. Spend a few minutes at the The Great Globe Gallery. Look at some of the projections and other views that seem interesting.
A map needs a scale that allows the user to determine the distance between two (or more) places on the map. The scale might be presented as a bar scale (common on most road maps); for example, inch on the map equals 20 miles on the ground. Or, the scale on a map might be given as a ratio -- 1:62,500, for example, which means that one unit on the map equals 62,500 of those units on the ground. Or, 1 inch on the map equals 62,500 inches on the ground. This is approximately 1 inch on the map equals 1 mile on the ground. What would be the exact scale if 1 inch equals 1 mile?
In addition, orientation of the map needs to be indicated by showing the direction to the North Pole. A compass points to the North Magnetic Pole (which is not located at the North Geographic Pole) The deviation between these two poles (the magnetic declination) should be shown on the map. Try Finding Your Way with Map and Compass .
A Topographic map shows the variations in elevation of the area represented on the map with contour lines. A contour line on a map connects points that are at the same distance above, or below, sea level (or some other reference surface). For example, the 20' contour line connects all points on the map that are exactly 20' above sea level. For each map a contour interval is selected; this is the vertical distance between adjacent contour lines. If the contour interval is 10', then the next highest contour line is the 30' line and the next lowest is the 10' line. If a point on a map is between the 20' and the 30' contours all you know is that the point is greater than 20' above sea level and less than 30' above sea level; you can not "guess" the exact elevation.
The spacing of contour lines on a map tells you how "steep" the slope is. If you had a map of a "dome" (an upside down bowl) the contour lines would be equally spaced around the dome. If there is a high with a very steep side and a very gentle side, the contour lines would be very close together on the steep side and further apart on the gentle side. Thus, a topographic map allows you to see the features present on the surface that are being represented. The difficulty, however, is that you are seeing a two-dimensional representation of a three-dimensional surface.
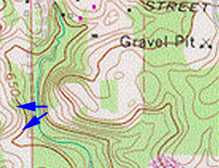
The topographic map is taken from the Internet-based exercise that is presented below. Note the presence of the river on the left-hand side of the map (blue). The contour lines bend around the stream to creat a "V-shaped" projection that "points" up stream. (Streams cut their channels into the bedrock or ground surface and hence the elevation of the stream is below that of the area surrounding the stream) South of the word gravel pit is a hill. Note that some of the contours are closed - - remember that all points on the surface that lie on the same contour line are at the same elevation above sea level.
Faculty at Calvin College in Michigan have devised an interesting set of exercises which can help you relate features on a topographic map to the land surface represented by the map.
Calvin College Topographic Map.
[Some of these maps are quite large and may be slow load if you are using a modem.] Click on the blue box near the bottom of the map. Look at the scale. Interpret the ratio :
-
1 : 24,000
How many miles on the ground are equivalent to 1 inch on the map?
Now, try their quiz.
Write a brief paragraph and describe whether you like or dislike this type of exercise. How did you do on the quiz?