Lecture 16:
Predator/Prey Cycles – Community Ecology
Predator/Prey interactions continued (factors leading to coexistence)
- Size escapes
(either young are too small or adults too large for predators to consume).
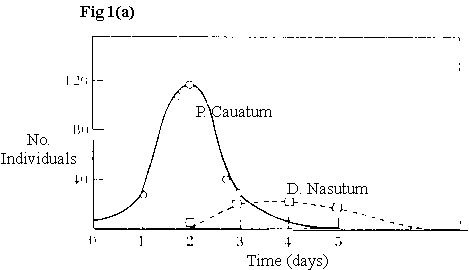
Examples: Refuge for prey - Gause’s experiments using protozoan, Paramecium (prey) and Didinium (predator).
|
|
Fig1. No. Individuals VS. Times (days)
without refuge in closed system ® prey go extinct, obviously not evolved under these conditions – natural systems are "open" |
|

|
With a refuge for the prey, the predator goes extinct |
|
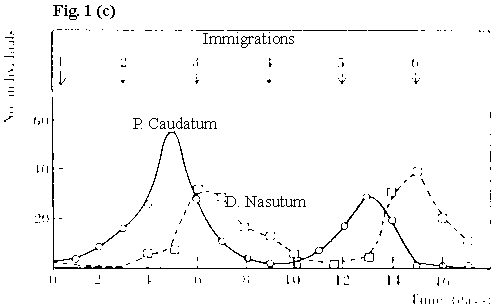
|
without a refuge, but with periodic immigration, predator and prey can coexist |
Huffaker’s 1958 "hide and seek" experiment with mite and mite predator. (Fig. 2)
- In the absence of predators, the herbivorous mite population flucuates through time but persists.
- With predatory mite added both prey and predator go extinct, despite heterogenous habitat.
- Coexistence possible when, in addition to heterogeneity, temporary barriers to predator migration are established.
Fig. 2: Huffaker’s 1958 "hide and seek" experiment with mite and mite predator.
(Left: Prey population; Right: Predator Population)
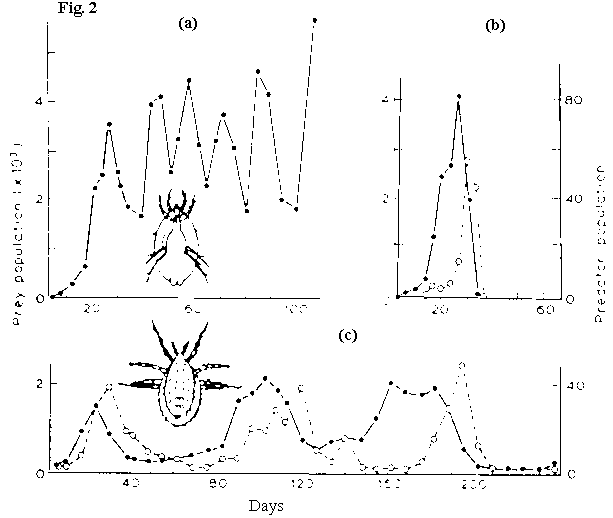
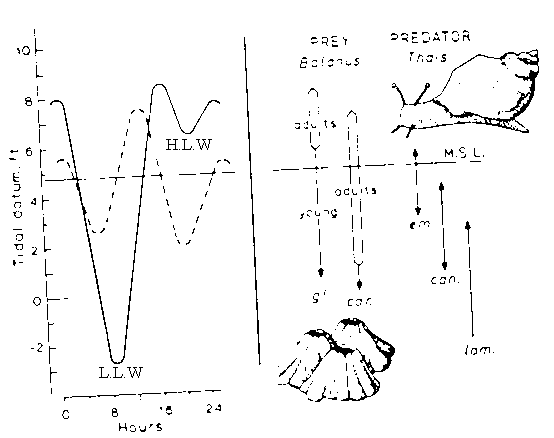
Fig. 3:
Example for 2) dispersal and immigration
Predators can exhaust prey by clumping. Predators disperse, prey re-establish by migration of larvae.
Size and spatial escapes – barnacles (prey) vs snail (predator)
Indirect spatial escapes

Fig. 4:
Bluegill (predator) vs invertebrate prey.
Vegetated ¬ ® non-vegetated
Fig. 4: When largemouth bass (which prey on small bluegill sunfish are present, many sunfish take prey form vegetation habitat where they are relatively protected from predation.
Without predation on either predator or prey both range over entire habitat
With predation on predator (largemouth bass on bluegill) Predator bluegill restricted to vegetated areas.
Classic case of coupled oscillation involves predator and prey interaction between snowshoe hare and Canadian lynx.
Since 1920’s ecologists looked at cycling in hare and lynx which was recognized by traders 100 years prior. Not fully understood until the 1970’s.
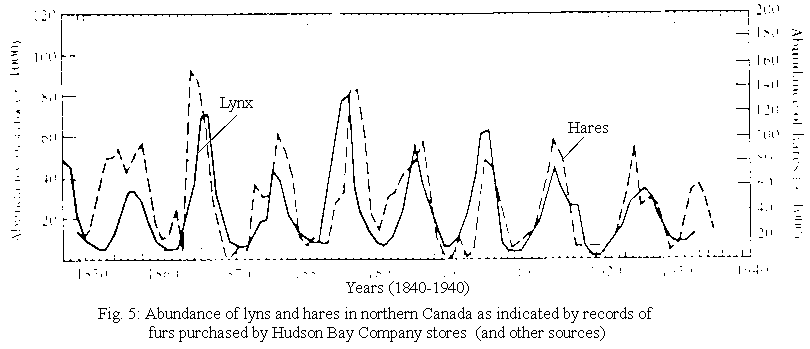
Fig. 5:
Lynx-Hare Coupled oscillations
(Left: abundance lynx; Right: abundance of hares)
Cycle has about 8-11 yrs periodicity. (fig. 5)
Hare feeds on twigs of numerous shrubs and small trees. Over 8-11 years period the abundance of hare changes 10 – 30 fold (up to 100x in favorable habitat which occurs over wide geographic range – Alaska to Newfoundland.
Researchers noted that decline of hare was characterized by:
- low birth rate
- low juvenile survivorship
- high weight loss and low growth rate.
Starvation due to low availability of food
Concomitant with increase, increase in grazing. Plant response is to produce toxins which remains unpalatable for 2-3 years.
Hare-plant interaction leads to decline in hare population – decline in hare population not a result of predator effects.
Predators decline as a result of prey decline. Decline of the lynx abated somewhat by ability to shift to grouse as alternative prey. Grouse cycling direct response to predation pressure.
If lynx were absent from system prey (hare) would probably still cycle, grouse would probably not cycle.
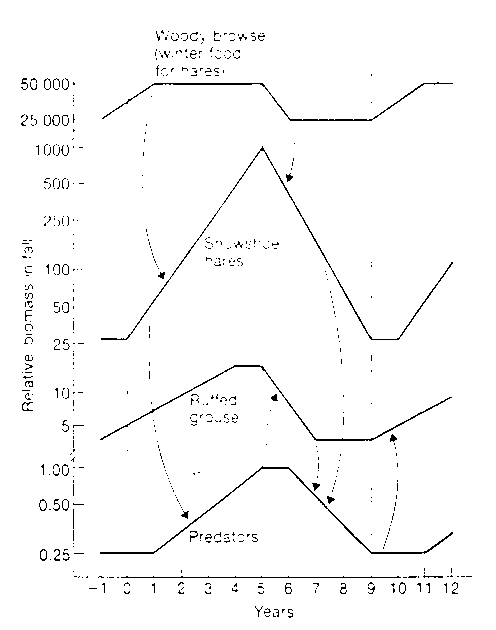
Fig. 6:
Fluctuations in relativie biomass of the major components of wildlife's 10-years cycle in Alberta, Canada. The arrows indicate the major causative influences.
(Left: Relative Biomass; Right: Years; Top to Bottom: Woody Browse(winter food for hares; Snowshoe hares; ruffed grouse, predators)
Community Ecology
Definition of community: assemblage of interacting species populations that co-occur in space and time.
To what extent do communities represent a fundamental unit like a population?
Two views:
- very predictable assemblage – packages of populations that have limited membership, or
- haphazard assemblage. Co-occurrence is a result of accidental dispersal and survivorship.
Reality lies somewhere in the middle. Most communities are defined by the predictable occurrence of a few species. The details of the assemblage often vary through time.
Strong interactions will define the predictability of the assemblage.
e.g. obligate mutualists where co-occurrence is necessary. Examples include coral reefs, plants and plant-pollinators, etc.
Interspecific interactions such as competition may limit inclusion of some species – lots of examples from introductions.
Statistical analyses are often used to determine whether interactions are organized or haphazard.
- association analysis - test for co-occurrence.
- ordination analysis - investigates distributions along environmental gradients. If sets of species represent "packages" then expect to predictable changes in species assemblages along gradient.
Two descriptive components of a community:
- Structure
- describes diversity, number of individuals and how they are distributed in community.
- Organization
– nature of interactions that determine the structure.
e.g. processes such as competition, predation, parasitism, symbioses, etc.
Some species are more important than others in the sense that they have more biomass or their presence controls the distribution and abundance of other species.
In the remainder of this lecture we’ll focus on the importance of competition as a force organizing communities.
We have examined the basic theory for inter- and intra-specific competition. From the Lotka-Volterra model we concluded that co-existence of species using similar resources is only possible when:
- interspecific competition is £ intraspecific competition, or
- species diverge in their use of resources such that they limit the degree to which they compete.
Let’s examine some of the details of the competition theory that has been used to explain patterns of community structure.
Do the patterns fit the expectation of competition theory?
Major assumption: populations exit at or near equilibrium with respect to carrying capacity.
Two approaches to evaluating competition in natural communities.
- indirect methods
- niche overlap estimates
- statistical inference based on analysis of patterns of distribution can detect evidence for competition past. Weakness is it cannot discount other explanations, or detect competition directly.
- direct methods
-manipulative experiments: tests directly for the occurrence and strength of competition. Weakness it cannot evaluate competition past. Also, limited to situations amenable to experimental manipulation.
Experiments to test for competition between two or more species:
Species A alone add species B Þ 3 possible outcomes.
- A and B coexist (little or no competition)
- A wins, either because B loses in competition or resources for B not available in habitat where A occurs.
- B eliminates A by competition
Species A alone add species B but remove A Þ 2 possible outcomes:
- B does not become established, apparent resources not available.
- B becomes established.
Conclusions:
1, 2 and 4 - no present competition
3, 5 – competition controls distribution
What about when two species are present in similar habitat but do not overlap in distribution? Is the absence of overlap due to competition?
Experimental manipulations:
- remove A
Þ possible outcomes: a) B expands into region occupied by A (competition), or b) B does not expand (no competition).
- remove B
: Þ possible outcomes: a) A expands into area occupied by B (competition), b) A does not expand into area occupied by B (no competition).
What is the evidence for present and past competition? Depends on criteria for accepting evidence.
Competition predicts:
- niche diversification
- character displacement
- species replacement
1 and 2 lead to coexistence
3 species do not coexist
Example: Pacala and Roughgarden (Fig 7)
Study combined theory, observation and experimental manipulation to show that species with greater resource overlap (less partitioning) compete more for resources than species with less overlap. Very elegant study.
Study focused on Anolis lizards on Caribbean Islands
Idea: more partitioning, less competition; less partitioning, more competition
e.g. with more overlap/more competition
|
On St. Maarten |
Size (mm) |
Perch height (m) |
Horizontal space (%) |
|
Denuded |
forest |
|
Anolis gingivinus (AG) |
41 |
0.88 |
41 |
59 |
|
A. wattsi pogus (AWP) |
38 |
0.17 |
48 |
52 |
e.g. with more overlap/more competition
|
On St. Eustatius: |
Size (mm) |
Perch height (m) |
Horizontal space (%) |
|
Denuded |
forest |
|
A. bimaculatus (AB) |
53 |
2.01 |
14 |
86 |
|
A. wattsi schwartzi (AWS) |
40 |
0.16 |
65 |
35 |
Abstract and fig 7
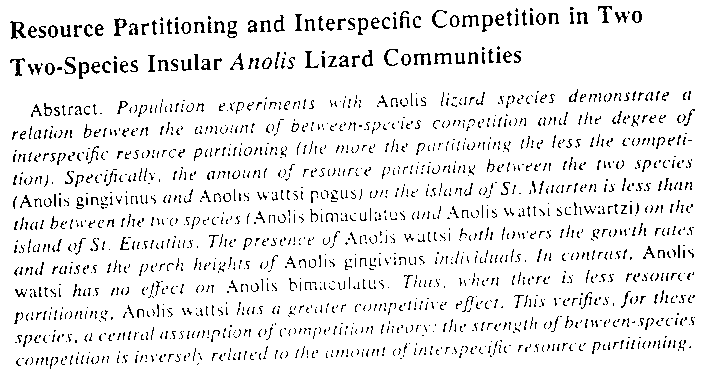
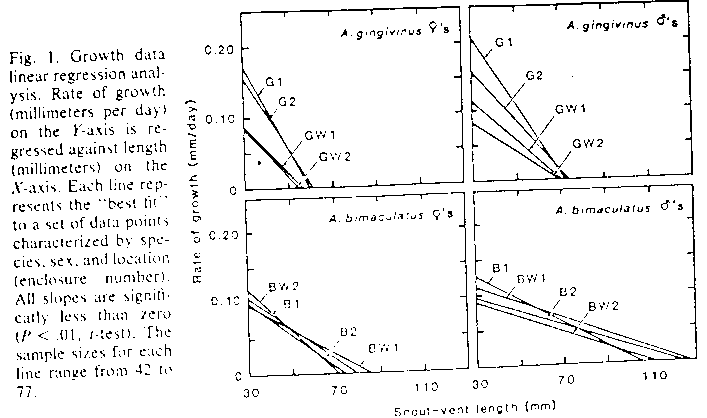
Based on direct studies how prevalent is competition?
Connell 1983 review
72 studies – freshwater, terrestrial, marine
conclusions:
- competition detected in 40% of the experiments
- with competition, ¾ indicated intraspecific competition stronger than interspecific. Degree of resource partitioning?
- Marine systems showed higher frequency of competition (all sessile organisms compete for space – difficult to partition this resource)
- Larger-sized organisms compete more frequently than do small species (limited by predation?)
- Competition asymetrical, but usually reversals are uncommon.
- Competition less frequent when > 2 competitors present.
- Competition varied year to year
Under-representation of studies that found no evidence for competition.
With respect to niche diversification, one indirect method is to examine patterns of reesource utilization. This approach is usually applied to "guilds" of species – groups of species which use the same general resources.
e.g. plantivorous fishes, grazing undulates, etc.
The resource most often limiting is food.
1st step – measure niche breadth, the range of the resources used.
Wide breadth
® generalist
Narrow breadth
® specialist
Competition theory holds that in a community there should be few generalists (opportunists) and many specialized (with respect to the same trophic level)
Using breadth you can calculate niche overlap for all species. Assumed to be an estimate of the potential intensity of competition among species for potential resources.
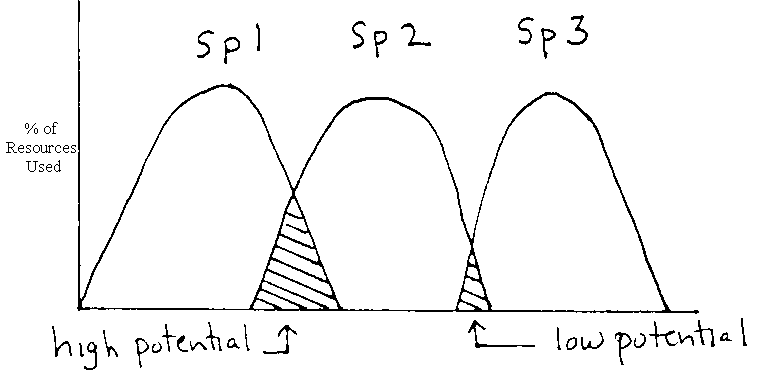 Fig 8
Fig 8
From theory – more overlap, more potential competition.
Overlap values (calculate in lab) are often equated with the L/V competition coefficients. Assumed that the degree of overlap is indicative of intensity of competition.
Not necessarily true for at least two reasons:
- with interference competition (e.g. territoriality) competition can be intense yet niche overlap may be minimal. (e.g. Connell’s barnacles, plant zonation patterns, etc,).
- High resource level may lead to high resource overlap, potential may high but if resources never limiting it does not mean anything.
Theory behind niche overlap estimate is concept called limiting similarity.
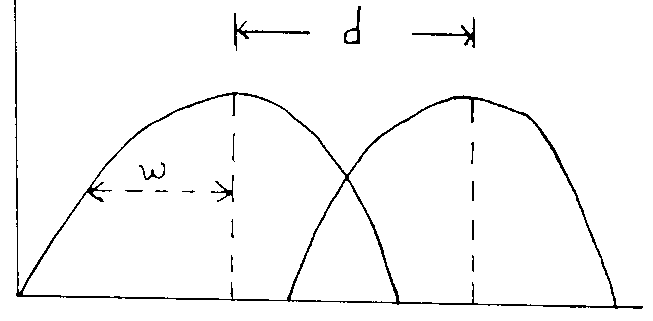 Fig. 9
Curves assume that populations have same carrying capacity and consumption rate is highest at the peak.
Intensity of competition (a ) = e-d^2 / 4w^2
|
Intra and interspecific competition balanced when (a ) = 1
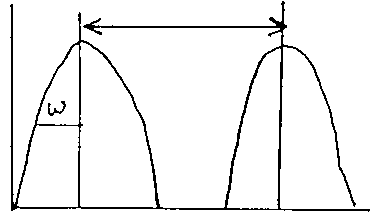
(a ) will b/w small when d/w >> 1
fig 10: |
intraspecific competition will drive w wider
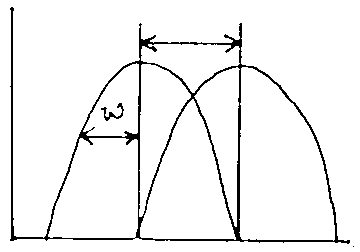
( a ) will be larger when d/w < 1
fig 11: |
|
|
|
interspecific competition drives species apart to avoid extinction.
So, natural selection should converge on d/w=1, Leads to niche differentiation.


 Fig 8
Fig 8  Fig. 9
