Development of an in vitro substrate for cell culture that enables a 3D microenvironment.
There is considerable evidence that conventional adherent two-dimensional (2D) cultures in polystyrene flasks fail to fully capture the cellular phenotypes found in vivo. We have developed a platform that overcomes the shortfall of conventional culture, by enabling 3D microenvironments via micropatterning technology. Our innovative approach utilizes biomaterial surface properties for cell adhesion and aggregation without the need of complex biochemical surface modifications that are used currently.
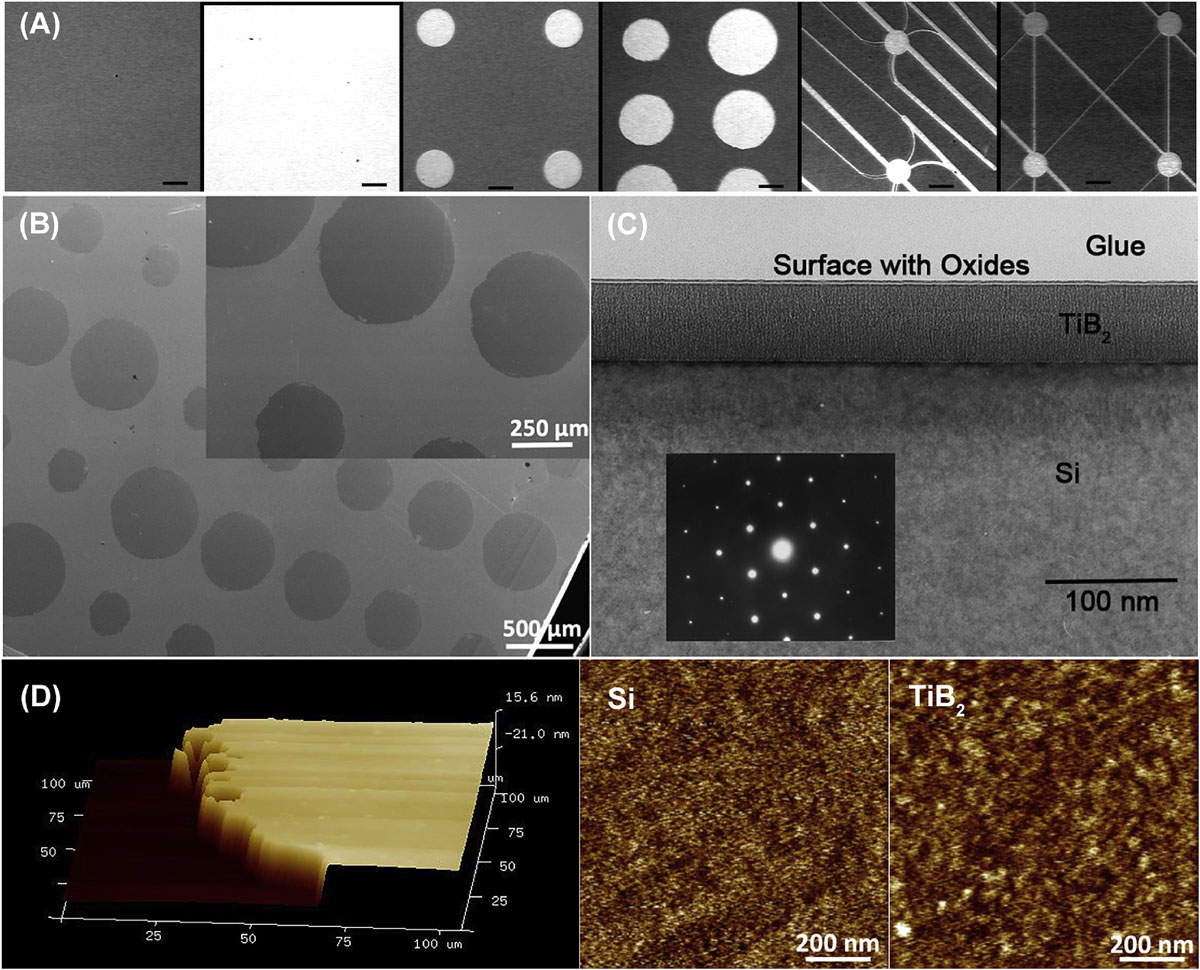
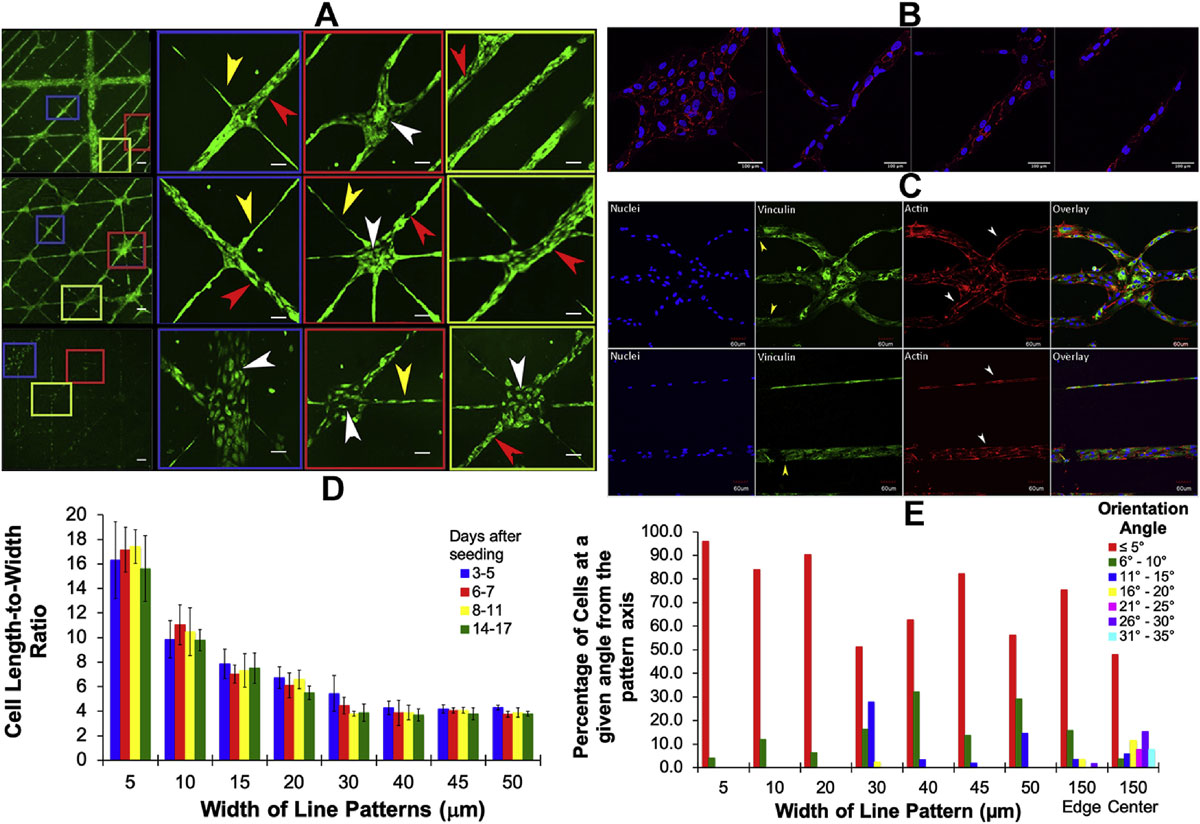
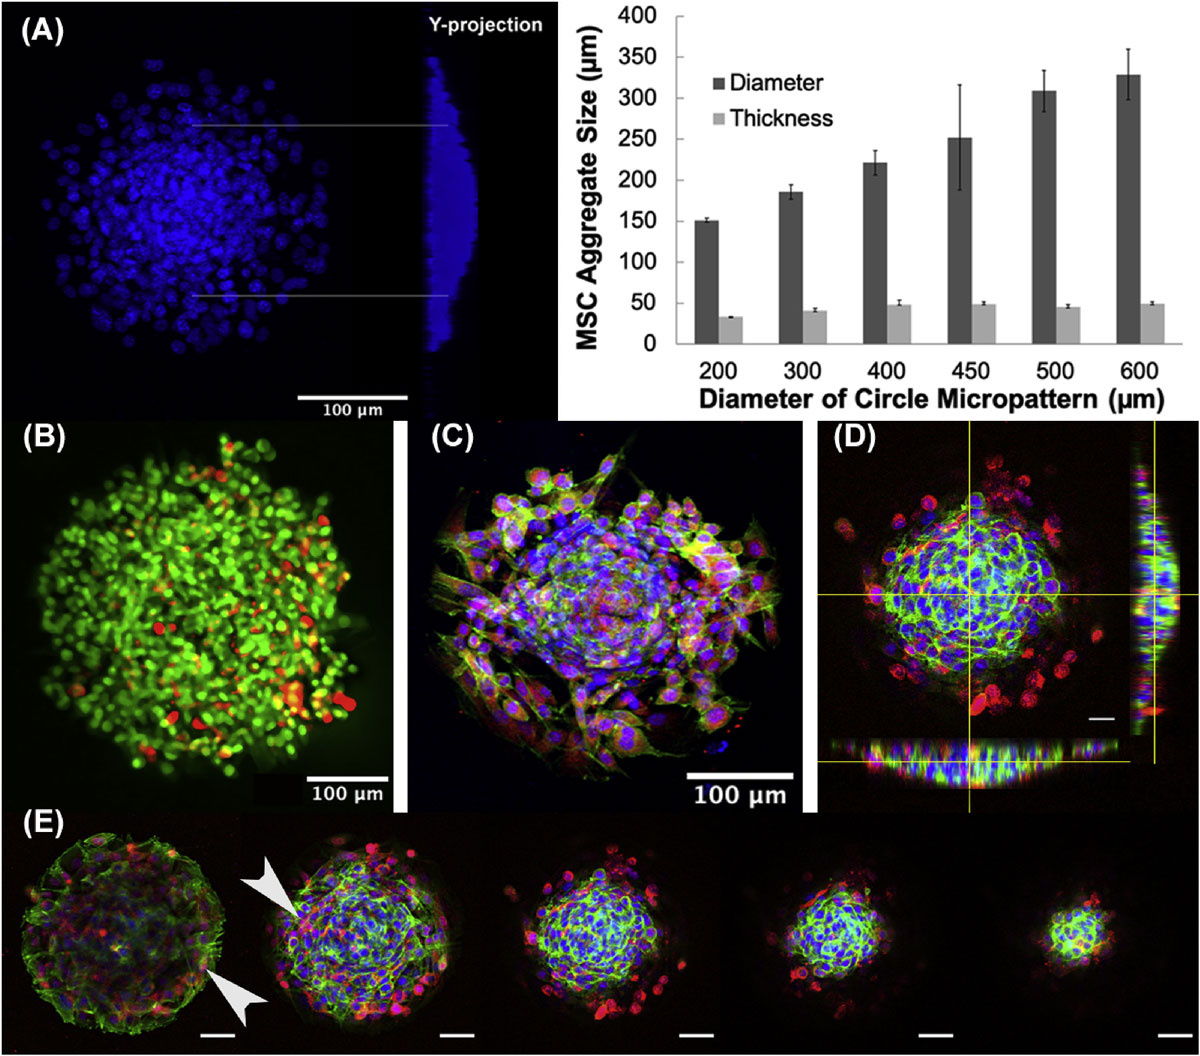
Visualization of micropatterned substrates using a variety of imaging methods for surface characterization. (A) Panel of six substrates designs (100 μm scale bar): Unpatterned Silicon (Si), Unpatterned Titanium diboride (TiB2), Si with TiB2 circle patterns of 200 μm diameter, Si with TiB2 circle patterns ranging in diameter from 200 to 600 μm, Si with TiB2 circle patterns of diameter 100 μm and lines of widths 5–20 μm, and Si with TiB2 circle patterns of diameter 100 μm and lines of widths 5–10 μm. (B) SEM images of the micropatterned substrate at two different magnifications, (C) TEM cross-section of as-deposited TiB2 on Si, with inset SAED pattern indicating amorphous structure of TiB2 layer. (D) AFM of patterned substrate. 3D height data of an interface area Si–TiB2, thickness of TiB2 layers is about 40 nm, high-resolution topography of an Si background (height range 0–1.0 nm), and high-resolution topography of a TiB2 pattern (height range 0–1.6 nm).Visualization of viability, biomarker expression, and alignment to micropatterns in HUVECs. (A) Fluorescence images of HUVECs stained with viability dye, Acridine Orange, growing on micropatterned substrates with varying geometric patterns of circles and lines (rows 1–3). Images in column 1 are at 4× magnification (scale is 150 μm), with selected areas (colored boxes) in the low magnification images shown at a higher magnification of 20× (columns 2–4, scale is 50 μm). (B) HUVEC cell phenotype immunofluorescence staining for the platelet endothelial cell adhesion molecule 1 (PECAM-1, also known as CD31). (C) HUVEC cell structural immunofluorescence staining for actin (cytoskeleton) and vinculin (focal adhesions). Nuclei are stained blue with DAPI. (D) Plot of HUVEC shape (elongation) on micropatterned substrates with circle and line patterns over a two-week period (scale 150 μm). (E) Quantitative analysis of cell orientation on line and circle patterns.Morphological, viability and biomarker assessment in MSC 3D aggregates. (A) An XY- and Y- maximum intensity projection generated from confocal z-stacks of the DAPI stained nuclei of an MSC 3D aggregate on a TiB2 circular micropattern, and a plot of aggregate size (diameter and thickness) versus the pattern size (diameter of circle patterns). (B) Maximum intensity projection generated from confocal z-stacks of an MSC 3D aggregate on a 300 μm diameter circle pattern stained for viability with Acridine Orange (green, live) and Propidium Iodide (red, dead). (C) Maximum intensity projection generated from confocal z-stacks of an MSC 3D aggregate on a 300 μm diameter circle pattern, stained for F-actin (green), nucleus (DAPI, blue), and CD105 (red). (D) Maximum intensity orthogonal projections generated from confocal z-stacks of an MSC 3D aggregate on a 600 μm diameter circle pattern, stained for F-actin (green), nucleus (DAPI, blue), and n-cadherin (red). (E) Individual z-slices for the image in (D) with grey arrows showing clustering of N-cadherin in aggregate vs homogenous staining in cells at pattern boundary (scale 100 μm).
Differentiation of mesenchymal stem cells (MSCs) into insulin producing cells (IPCs) for treating Type 1 Diabetes Mellitus using a microfabricated platform for 3D culture.
Evaluating effectiveness of epigenetic drugs in invasive ovarian cancer in 3D microenvironments.
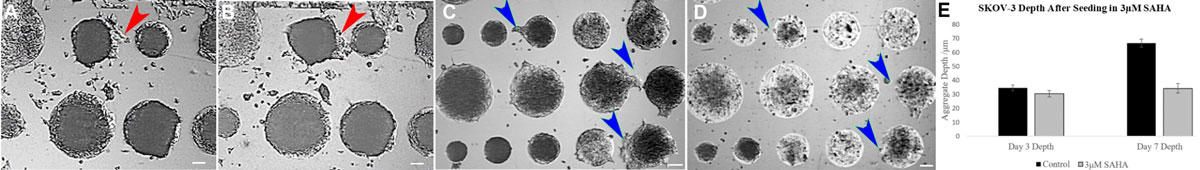
Effect of SAHA on SKOV3. (A-B) Untreated Day 7 and Day 9. Growth of cellular bridges is seen (red arrows, 100 m scale). (C) Day 7 image showing compact 3D aggregate formation and cellular bridges (blue arrows). Aggregates were treated with 3µM SAHA for 48 hours. (D) Images taken on Day 9 after SAHA treatment show disassociation of cells resulting in reduction in size of aggregates and loss of cellular bridges (blue arrows). (E) Plot of aggregate depth compared to controls (mean ± SEM.; n=3; *p < 0.001, using paired t-test) show a ~50% reduction in size post-treatment with SAHA).