
Quantitative biology & multidimensional imaging

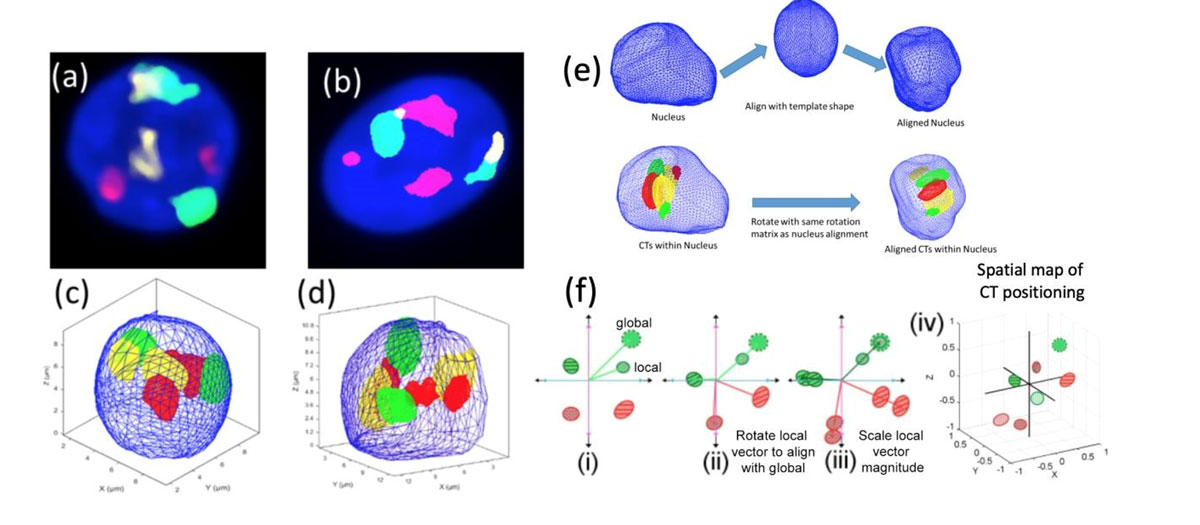
3D modelling for mapping the nuclear localization of genomic components using Spherical harmonics (SPHARM)

SPHARM based shape modeling of CTs for chromosome X(green), 8(yellow) and 12(red)
SPHARM based shape modeling of CTs for chromosome X(green), 8(yellow) and 12(red), delineated using 3D FISH, (a) Diploid, (b) Trisomy 12. Plot of 3D surfaces generated using surface modeling for nucleus (blue) and the enclodes CTs, (c) diploid and (d) Trisomy 12. (e) Alignment based on nucleus shape applied to CTs. (f) Common reference frame denoting CT postion w.r.t a structural landmark, (i-iii) Identification of reference global CT and alignment and scaling of local (most proximal) CT to global landmark position with the cell. (iV) 3D spatial position of each CT is then visualized relative to the structutal landmark.

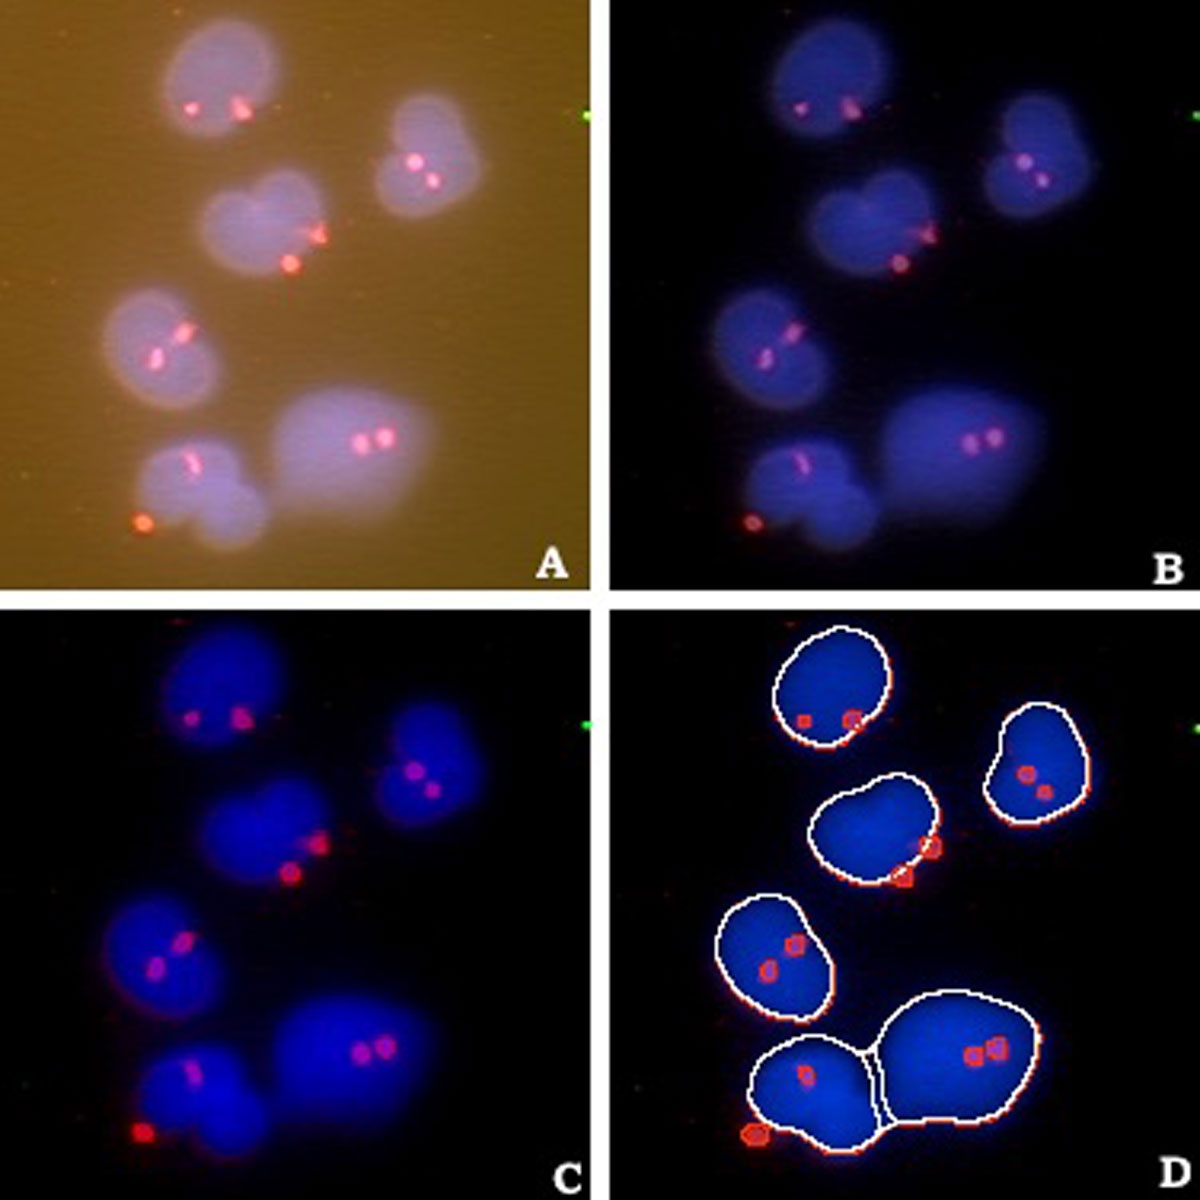
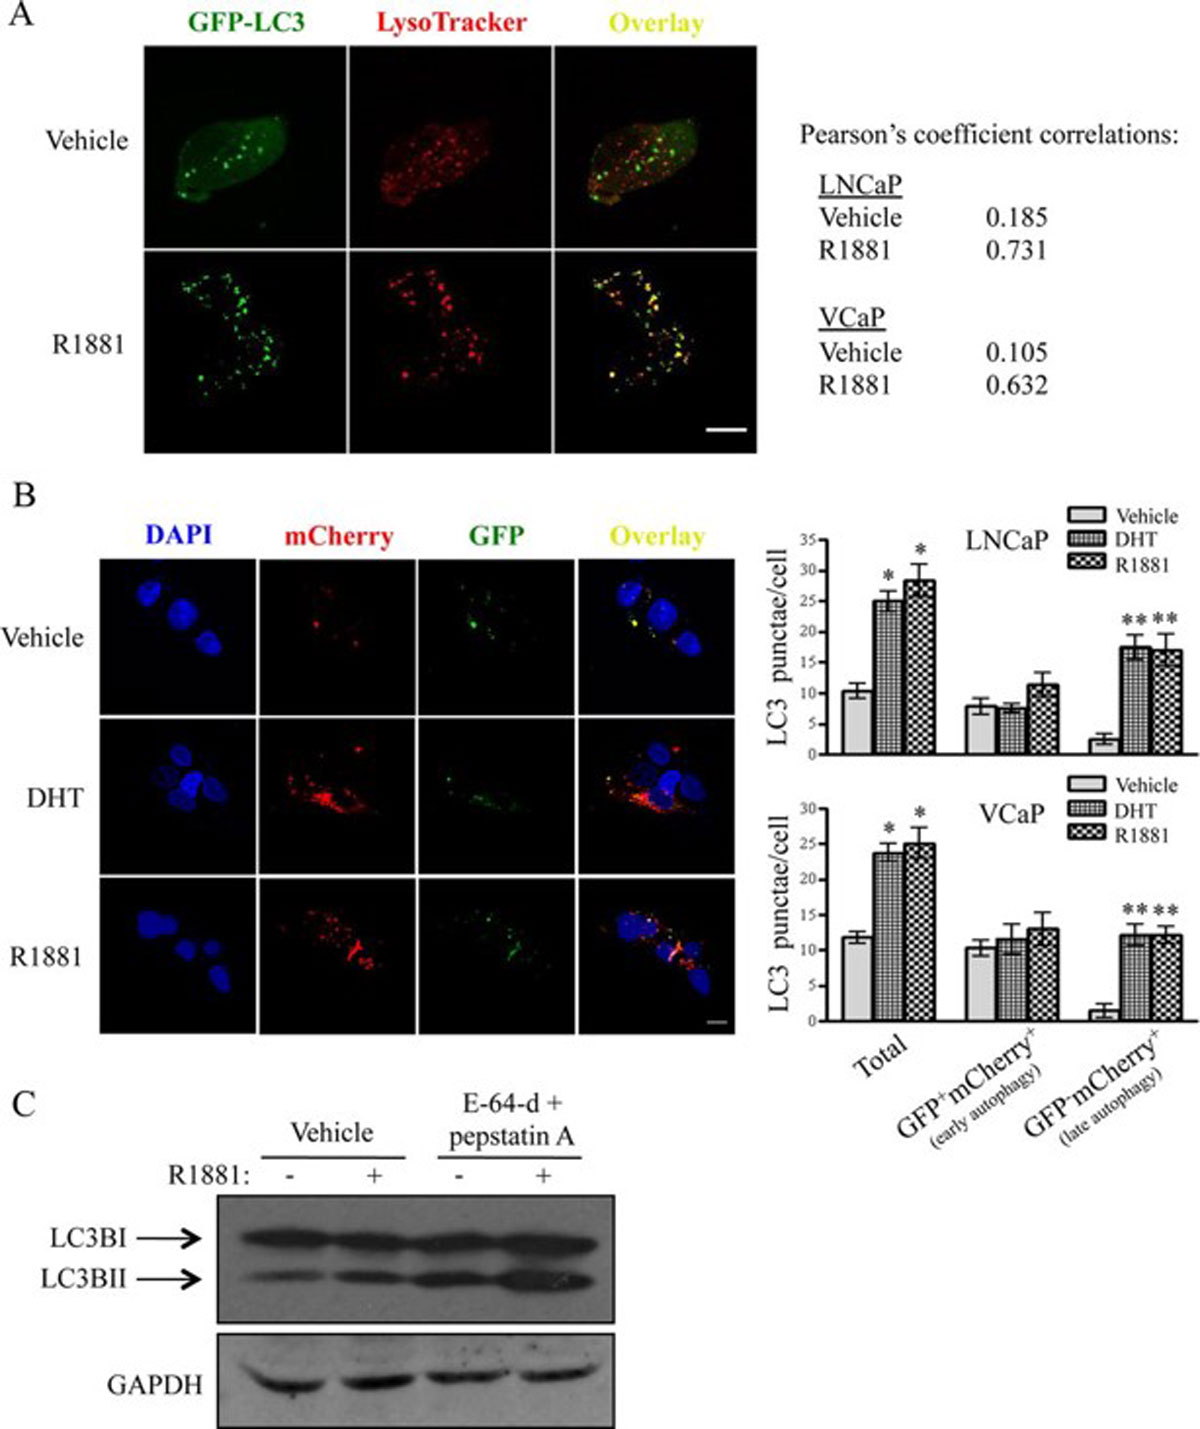
Analysis of co-localization and quantification of biomolecules in microscopy images

Statistical analysis on fluorescence microscopy images is routinely used for understanding cellular processes and their interactions
Statistical analysis on fluorescence microscopy images is routinely used for understanding cellular processes and their interactions. Co-localization algorithms have proven effective in such studies.  Our research on understanding the role of androgen  in promoting cancer prostate cell growth studied lysosome and autophagosome colocalization in fluorescence microcopy images.

Computational cytometry

FISH image of 6 female (XX) cells
FISH image of 6 female (XX) cells. Cells are counterstained blue (DAPI); X chromosomes are labeled in red (Texas Red). Results of automated image analysis, (A) original image, (B) background subtracted image, (C) color compensated image, and (D) results of automated cell and dot finding.