Flood Prediction
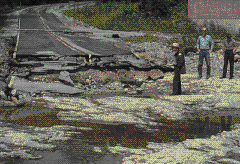
 A flood-ravaged road, once traveled by visitors to Coralville Lake, ends abruptly in a series of bedrock ledges that take visitors on an unexpected journey into Iowa's geologic past
(U.S.G.S.).
In the table that follows the N Maximum Annual Discharge data are ranked with the largest discharge having rank M = 1 and the smallest rank M =15 (in this case).
The Recurrence Interval (RI) is the average interval, in years, between occurrences of two discharges of equal (or greater) magnitude. This
relationship, known as the Weibull equation, can be written:
where N and M are defined as above.
The Annual Exceedence Probability (P) is the probability (expressed as a percentage) that a flood of that magnitude or greater will occur in a given year and is given by:
Maximum Annual Discharge Along The Diamond River, Wentworth, New Hampshire
| Year | Maximum Annual
Discharge (cfs) | Rank | Recurrence Internal | Exceedence Probability |
|---|
| 1982 | 4,600 | 11 | 1.45 | 68.75% |
| 1983 | 6,500 | 5 | 3.20 | 31.25% |
| 1984 | 8300 | 2 | 8.00 | 12.5% |
| 1985 | 7250 | 4 | 4.00 | 25.00% |
| 1986 | 6,000 | 6 | 2.67 | 37.50% |
| 1987 | 5,200 | 8 | 2.00 | 50.00% |
| 1988 | 8,000 | 3 | 5.33 | 18.75% |
| 1989 | 4,500 | 12 | 1.33 | 75.00% |
| 1990 | 5,000 | 9 | 1.78 | 56.25% |
| 1991 | 4,200 | 13 | 1.23 | 81.25% |
| 1992 | 9,400 | 1 | 16.00 | 6.25% |
| 1993 | 3,600 | 15 | 1.07 | 93.75% |
| 1994 | 5,800 | 7 | 2.29 | 43.75% |
| 1995 | 4,000 | 14 | 1.14 | 87.50% |
| 1996 | 4,700 | 10 | 1.60 | 62.50% |
What is the Recurrence Interval for the largest event out of 99 events?
What is the Recurrence Interval for the smallest event out of 99 events?
What is the probability of occurance of an event with a discharge of 5,200 cfs?
An event has a Recurrence Interval of 3. This means that there is an average interval of 3 years between events of this (or greater) magnitude.
A 100-Year flood occurs in 2000. There will be no flood of equal or greater magnitude until 2100
Always pay attention to any transformation that is used in analyzing a problem. Look at the distribution of the RI values in the above table. Note that the largest event in a series will always have an RI of (N+1) where N is the number of points in the data set (the number of years worth of data). The second largest event will always have an RI half that of the largest event ((N+1)/2). The third largest event will have an RI 1/3 of that of the largest event ((N+1)/3) and so on. The Weibull equation forces the RI values to be relatively far apart for the smallest values and very close together for the largest values.
Examine a plot of maximum annual discharge versus recurrence internal. Follow through the discussion of transformations that may be applied to such data. The logarithmic transformation that is described and illustrated is used for other data sets as well and often appears in text books and newspaper articles.
Return